#293 — February 20, 2019

Read on the Web

Postgres Weekly

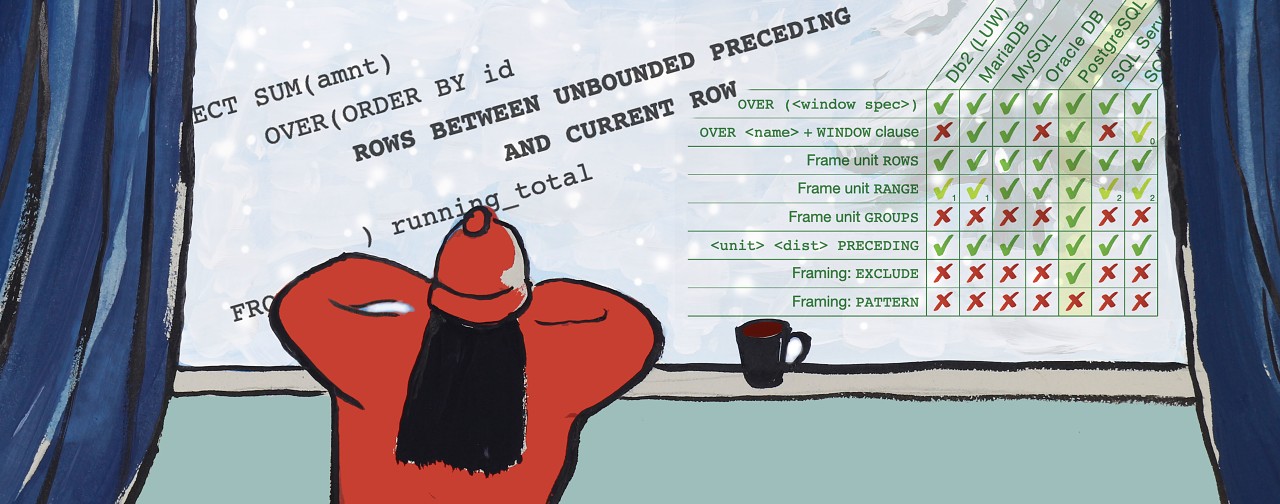
Postgres 11 Reestablishes Window Functions Leadership — PostgreSQL 11 once again offers the best OVER clause support among its competitors, plus a comparison of Postgres 11’s procedures feature versus other systems like MariaDB and SQL Server.

Markus Winand

Postgres 11.2, 10.7, 9.6.12, 9.5.16, and 9.4.21 Released — Another barrage of releases which usually means a lot of widely applicable bugfixes are in place.. that’s true here too, but the main improvement is in Postgres’s usage of fsync() which was, as we reported last week, somewhat incorrect till now.

PostgreSQL Global Development Group

Metrics to Monitor in Your PostgreSQL Database — There are several key metrics you’ll want to keep track of when it comes to database performance, and they’re not all database-specific.

InfluxData sponsor

SQL: One of the Most Valuable Skills — Craig Kerstiens of Citus Data explains why, out of all the skills he’s picked up over the course of his career, SQL remains the most valuable.

Craig Kerstiens

DigitalOcean Introduces a Managed Postgres Service — DigitalOcean joins other providers like AWS, Google, MS Azure, and Heroku in offering managed Postgres instances. These look particularly great if you want something on a tight budget. Here’s a list of the installed extensions (which includes TimescaleDB, intriguingly).

DigitalOcean

How Much maintenance_work_mem Do You Need?work_mem is a key configuration setting for your database, but it can be confusing to understand how much you need. Robert Hass, Postgres committer, highlights the problem and attempts to explain why things are as they are.

Robert Haas

Geo-Redundancy of Postgres Backups with BarmanBarman 2.6 introduces support for geo-redundancy, meaning that Barman can now copy from another Barman instance, not just a Postgres database.

Gabriele Bartolini

Master-Replica & Master-Master PostgreSQL Architectures — Learn about the different ways to achieve high-availability for your PostgreSQL environment.

Severalnines sponsor

Looking at MySQL 8 with Postgres Goggles On — If you’re a heavy Postgres user, you might not have taken a look at MySQL for many years. But if you’re curious what MySQL is like now, Kaarel has done the looking for you and even finds some features he’d welcome in Postgres.

Kaarel Moppel

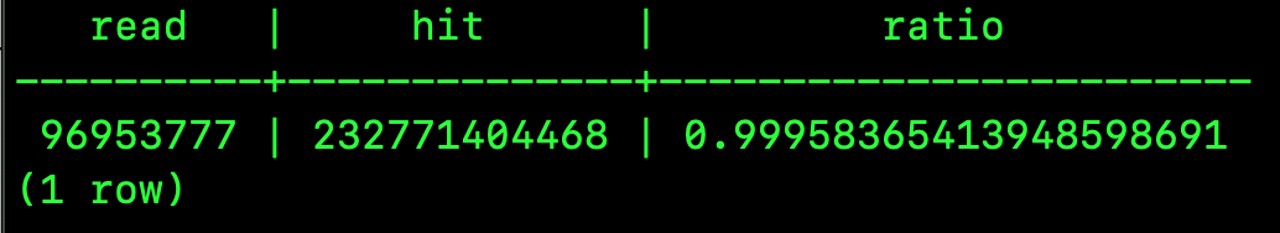
How to Calculate a Cumulative Percentage in SQL

Lukas Eder

What is Citus? Scale-Out Clustering and Sharding for Postgres — Microsoft acquired Citus Data a few weeks ago, but what does their technology even do? This is a good high level explanation.

Baron Schwartz

Amazon Aurora with Postgres Compatibility Supports PG 10.6

Amazon Web Services

supported by

💡 Tip of the Week

How to check the effectiveness of your table caches

Caching is an important factor in making any database faster and prevents a lot of unnecessary work taking place, such as costly disk reads.

Postgres uses various types of caching to keep things running smoothly, but we're going to focus on checking the effectiveness of the table caches that cache your tables' data.

In psql, select your database and then run this query:

SELECT * FROM pg_statio_user_tables;

You might find the results a little opaque and confusing on their own, but essentially you get to see the IO statistics for each of your tables, including how many 'blocks' of data have been served from the cache (i.e. heap_blks_hit).

We can bring together all of this data into a more readable format with a query like this:

WITH y AS (
  SELECT
  sum(heap_blks_read) AS read,
  sum(heap_blks_hit) AS hit
  FROM pg_statio_user_tables
) SELECT read, hit, hit / (hit+read)
  AS ratio FROM y;

On a database of mine, I get this result:

Our new query has added together all of the relevant numbers to show how many cache hits occurred, how often the cache didn't deliver (heap_blks_read is the number of disk blocks read) and we calculate the ratio of hits to the total number of blocks read.

In this case, our cache is working effectively as the hit rate is almost 100%. But in a low memory environment or when a server is under particular strain, you may see lower numbers. Take note of these and be prepared to upgrade your database server.

It's possible to go further with checks like these and also dig into things like index usage and index caching as covered by Craig Kerstiens in Understanding Postgres Performance.

This Tip of the Week is sponsored by the database team at Citus Data, now part of the Microsoft family. Book a demo to see how Citus transforms Postgres into a distributed database.

If you have any ideas for your own tips, reach out here - we'll pay $50 for your tip if we use it in an issue.