This is a guest post co-authored by Fabrízio Mello and Álvaro Hernández, from OnGres.
Envoy 1.15 was released on July 6th, and it included an interesting mention in the release notes: a new plugin, for Postgres! This post will introduce why this plugin was developed, what functionality it currently implements, and what the roadmap looks like for future releases. For the TL;DR: head to the plugin documentation to see what it can do as of today and how to use it.
The main goal of the plugin is to be able to decode and interpret Postgres’ wire protocol format and extract valuable information from the Postgres traffic. This, in turn, may allow us to extract metrics, offload work from the Postgres server, or route Postgres traffic to different nodes. And all without requiring any configuration, extension or work on the Postgres server!
Motivation and initial design of the plugin
All the initial motivation and initial design considerations were explained in detail in issue #9107. Quoting from that issue:
“The main goal of this project is to add network observability to PostgreSQL. By decoding the PostgreSQL wire protocol within the Envoy filter, it would be possible to extract relevant information about the activity and the performance of a Postgres server, like the number of queries per unit of time, types of queries and the performance of those queries.”
The usual Postgres DBA may argue that this information you can already obtain from Postgres. Multiple monitoring tools and queries to Postgres metainformation may allow us to capture it. While certainly true, there are several problems with these approaches:
- Most of these tools are pull-based: you need to query the database to obtain the information, repeatedly, so it is normally coarse-grained.
- Some of the monitoring information is to be observed incrementally (think for example of the execution latency of a query observed over time). Given that pull-based queries give you snapshots at each time, you need to compute “diffs” between snapshots, which is cumbersome or directly impossible (e.g. the percentiles).
- It may require the installation of tools on Postgres, some of them may even require a restart of the database after installation, leading to some downtime.
- They add load to Postgres. It’s better to offload as much work from Postgres as possible.
The main advantage of adding Postgres observability to the Envoy proxy is that it is totally transparent to Postgres: no installation, configuration, or restart is required on Postgres servers, and it adds no load to them. Additionally, Envoy supports counters and histograms, so metrics can be captured continuously.
The plugin features in Envoy 1.15
Basically this first release of the plugin adds observability to Postgres. In essence, it decodes the Postgres traffic that goes through it and publishes metrics to Prometheus (or any metrics sink that you may have configured for Envoy). Metrics like:
- Upstream and Downstream connections. This filter is derived from the TCP proxy filter that already exposes those metrics.
- Sessions and transactions. You can distinguish by encrypted/unencrypted sessions, and by committed or rolled back transactions.
- Statements, and drill those down by SELECT, INSERT, UPDATE, DELETE and “others”.
- Notices and error messages, which can also be exposed as more specific subtype counters.
This is detailed in the Postgres Plugin documentation.
Current limitations
The current implementation is not able to decode the SSL encrypted traffic, and thus metrics are only exposed for non-SSL connections.
How to use it
The Postgres proxy filter should be chained with the TCP proxy as shown in the configuration example below:
...
filter_chains:
- filters:
  - name: envoy.filters.network.postgres_proxy
    typed_config:
      "@type": type.googleapis.com/envoy.extensions.filters.network.postgres_proxy.v3alpha.PostgresProxy
      stat_prefix: postgres
  - name: envoy.tcp_proxy
    typed_config:
      "@type": type.googleapis.com/envoy.extensions.filters.network.tcp_proxy.v3.TcpProxy
      stat_prefix: tcp
      cluster: postgres_cluster
To avoid YAML indentation issues you can download the configuration example file.
We should pay attention mostly to the static_resources section, which is the place we’ll configure the upstream connection by setting up the clusters section pointing Envoy to the Postgres server. And then we need to set up the listeners section creating a filter chain between TCP Proxy and Postgres Proxy filter.
According to the example above we’re using the local IP address 127.0.0.1 port 54322 for Envoy listener, and port 5432 for Postgres considering it’s already running.
Following these simple steps we’ll be able to get some Postgres metrics from Envoy:
- Running Envoy as a frontend proxy for Postgres:
$ getenvoy run standard:1.15.0 -- -c postgres.yaml
- Getting Postgres filter statistics using curl:
➜ curl -s http://localhost:8000/stats | grep egress_postgres
postgres.egress_postgres.errors: 0
postgres.egress_postgres.errors_error: 0
postgres.egress_postgres.errors_fatal: 0
postgres.egress_postgres.errors_panic: 0
postgres.egress_postgres.errors_unknown: 0
postgres.egress_postgres.messages: 0
postgres.egress_postgres.messages_backend: 0
postgres.egress_postgres.messages_frontend: 0
postgres.egress_postgres.messages_unknown: 0
postgres.egress_postgres.notices: 0
postgres.egress_postgres.notices_debug: 0
postgres.egress_postgres.notices_info: 0
postgres.egress_postgres.notices_log: 0
postgres.egress_postgres.notices_notice: 0
postgres.egress_postgres.notices_unknown: 0
postgres.egress_postgres.notices_warning: 0
postgres.egress_postgres.sessions: 0
postgres.egress_postgres.sessions_encrypted: 0
postgres.egress_postgres.sessions_unencrypted: 0
postgres.egress_postgres.statements: 0
postgres.egress_postgres.statements_delete: 0
postgres.egress_postgres.statements_insert: 0
postgres.egress_postgres.statements_other: 0
postgres.egress_postgres.statements_select: 0
postgres.egress_postgres.statements_update: 0
postgres.egress_postgres.transactions: 0
postgres.egress_postgres.transactions_commit: 0
postgres.egress_postgres.transactions_rollback: 0
- Generating some workload to Postgres using pgbench tool:
➜ pgbench -i -s10 -d "postgresql://postgres@localhost:54322/postgres?sslmode=disable"
dropping old tables...
creating tables...
generating data...
100000 of 1000000 tuples (10%) done (elapsed 0.06 s, remaining 0.58 s)
200000 of 1000000 tuples (20%) done (elapsed 0.13 s, remaining 0.51 s)
300000 of 1000000 tuples (30%) done (elapsed 0.19 s, remaining 0.45 s)
400000 of 1000000 tuples (40%) done (elapsed 0.26 s, remaining 0.39 s)
500000 of 1000000 tuples (50%) done (elapsed 0.32 s, remaining 0.32 s)
600000 of 1000000 tuples (60%) done (elapsed 0.39 s, remaining 0.26 s)
700000 of 1000000 tuples (70%) done (elapsed 0.45 s, remaining 0.19 s)
800000 of 1000000 tuples (80%) done (elapsed 0.51 s, remaining 0.13 s)
900000 of 1000000 tuples (90%) done (elapsed 0.58 s, remaining 0.06 s)
1000000 of 1000000 tuples (100%) done (elapsed 0.65 s, remaining 0.00 s)
vacuuming...
creating primary keys...
done.

➜ pgbench -c50 -n -T3600
"postgresql://postgres@localhost:54322/postgres?sslmode=disable"
WARNING!! In order to properly decode the Postgres raw protocol we should disable the SSL because the current version of the filter is unable to decode encrypted traffic.
- Check again the Postgres statistics:
➜ curl -s http://localhost:8000/stats | grep egress_postgres | grep -v ': 0'
postgres.egress_postgres.messages: 58735920
postgres.egress_postgres.messages_backend: 40859932
postgres.egress_postgres.messages_frontend: 17875990
postgres.egress_postgres.sessions: 51
postgres.egress_postgres.sessions_unencrypted: 51
postgres.egress_postgres.statements: 17875889
postgres.egress_postgres.statements_insert: 2553678
postgres.egress_postgres.statements_other: 5107389
postgres.egress_postgres.statements_select: 2553720
postgres.egress_postgres.statements_update: 7661101
postgres.egress_postgres.transactions: 17875888
postgres.egress_postgres.transactions_commit: 17875888
During the workload simulation using the pgbench tool the prometheus scrapper was getting metrics from Envoy accessing the endpoint http://localhost/8080/stats/prometheus. A simple configuration was used for scrapping on Prometheus:
scrape_configs:
– job_name: ‘envoy’
scrape_interval: 5s
metrics_path: /stats/prometheus
static_configs:
– targets: [‘localhost:8000’]
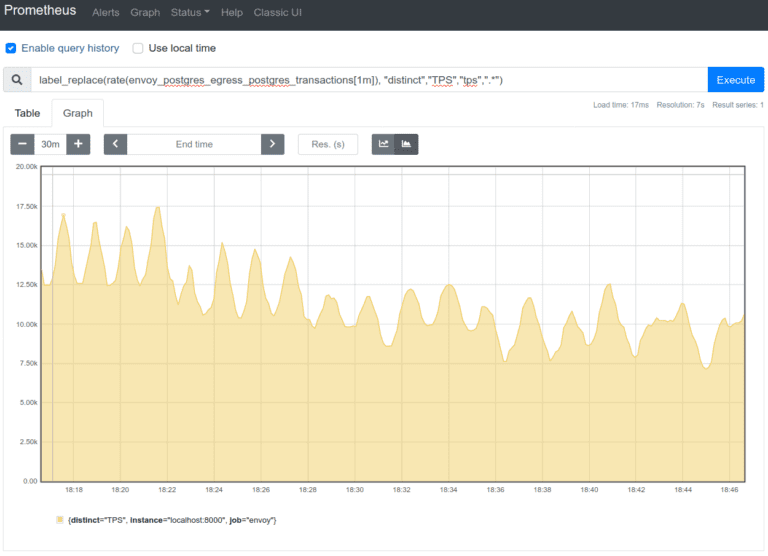
Below we’ll demonstrate some graph examples using simple promql queries:
1. Transactions per second (TPS)
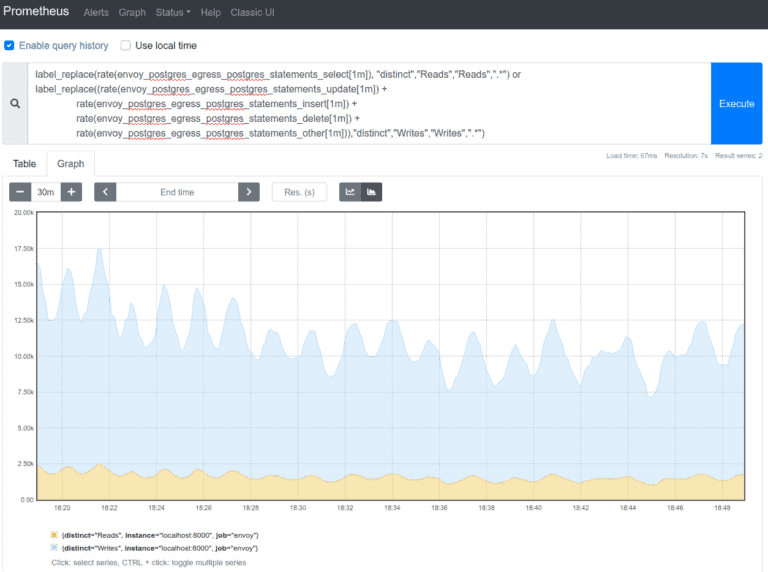
2. Reads and Writes (statements) per second
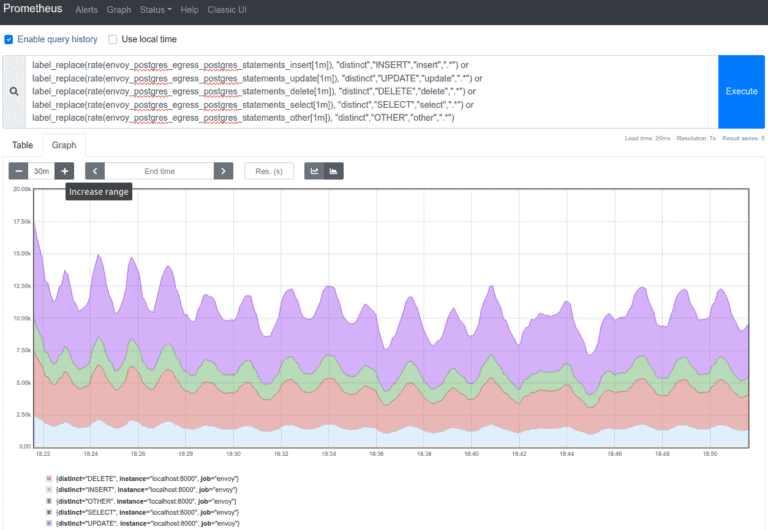
3. Statements per second
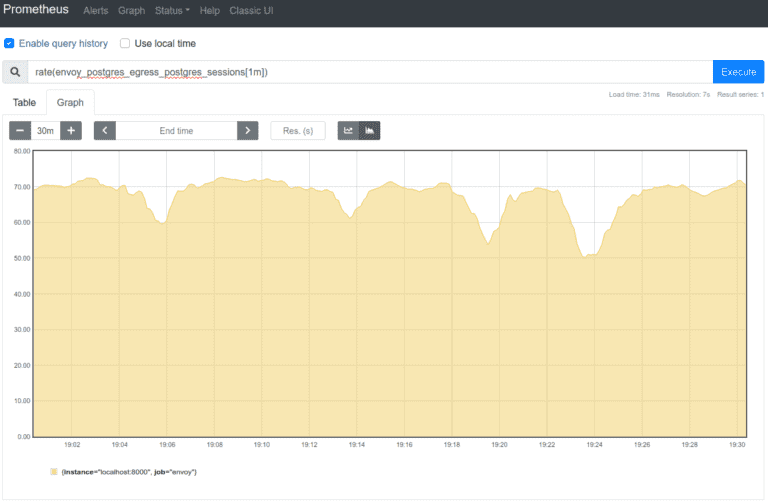
4. Sessions per second
What you can do with this plugin today
Add amazing metrics to your Grafana dashboards as demonstrated before! The information already exported is quite useful for capacity planning and performance troubleshooting, but also to detect query errors and invalid patterns.
We’re aware of several teams already working in integrating this extension to improve monitoring and adding Envoy proxying to their Postgres servers. It has also been deeply integrated into StackGres, an open-source Postgres-on-Kubernetes platform that leverages Envoy to proxy all traffic to Postgres and export the performance metrics to Prometheus.
We’d like to know what cool uses you are considering for this plugin, please spread the word!
The road ahead
But this is just the beginning. There are many expected future features to be developed for this plugin, other than observability. However, a staged design was proposed in which individual features will be released in successive versions. Issue #9107 already contains a glance of some of them (like aggregated query histograms or tracking individual query performance). Others are already being developed as of now, like:
- Issue 10942. When implemented, Envoy will be able to terminate Postgres client’s SSL connections, and offload SSL from Postgres. This not only reduces the load on the server, but also enables all the SSL certificate management tools to manage certificates for Postgres connections, and avoid the restarts needed in Postgres for its configuration.
- Issue 11065. This work will add metadata tags to the Postgres wire protocol packets, so that filters down the chain may take decisions, like routing decisions, based on those tags. Think of permission filtering or command routing, all happening at the proxy level. This issue is already committed and will make it, probably, to 1.16!
Stay tuned!
Acknowledgments
We’d like to thank Matt Klein in first place. Not only for creating Envoy itself, but also for believing in this plugin idea and connecting the necessary team that created this first release.
And thank to Dhi Aurrahman for the initial guidance creating the first POC of this filter, and Christoph Pakulski for all hard working polishing and turning the code acceptable for merging into Envoy.
Finally we’d like to thank our company, OnGres, for sponsoring our work on this project and committing it to be open source as part of Envoy.