2 weeks ago we announced a new, long awaited, Postgres extension to look into execution plans for “live” running queries: pg_show_plans. This was not possible before in PostgreSQL yet, so it’s really a very cool piece of functionality and we’d like to echo out the message again. So here in this blogpost we’ll reiterate some basics but also explain some more implementation details. Let's take a detailed look on the new PostgreSQL troubleshooting extension:
Table of Contents
Although in general PostgreSQL is an absolutely solid database product from all angles (2 recent “RDBSM of the year” titles testify to that) - time to time on busy / volume heavy system there are hiccups - queries suddenly last longer than you think. Of course you could see some crucial details (who, how long, is someone blocking, the exact query) already easily via the built-in pg_stat_activity view or the historical behaviour fur such statements via pg_stat_statements...but what was missing so far, was the ability to look at the exact query plan chosen for that currently running slow query! Only after the query finished it was possible to analyze the root cause of slowness by re-executing manually with EXPLAIN or with the auto_explain extension, slightly inconveniently via logfiles. But lo and behold - now it’s possible to look at execution plans of slow queries via SQL also in real-time as they’re being executed!
So what does this new pg_show_plans extension do exactly? In PostgreSQL terms - it copies query execution plan info from the private session / backend context to shared memory context when the query starts, so that it would be accessible also to other users. Using shared memory though requires “being there” when the server starts - so one needs to add the extension to the shared_preload_libraries list, optionally also configure some settings (see the configuration chapter below for details) and restart the server.
Currently the extension is provided to the public only as source code, so one needs to build it from sources. We of course provide RPM / DEB packages to all customers also in case needed. But building from sources is also very standard and painless if you're following the simple steps from the README or check out the previous blog post again where it’s compiled from any directory location. The README suggests going into the Postgres source folder.
Note that Postgres versions 9.1 and upwards, till 13 beta are supported.
As mentioned in the introductory chapter pg_show_plans needs to be there when the server starts to claim some shared memory and set up some executor event hooks so at least one line needs changing in the postgresql.conf or alternatively one ALTER SYSTEM command.
|
1 |
shared_preload_libraries = 'pg_show_plans' |
Besides that there are only a couple of parameters that could be of interest for more advanced users:
pg_show_plans.plan_format - controls the output format. By default it’s optimized for “humans looking at stuff”™ but if you plan to integrate with some visual query analyzing tool like PEV etc, you could opt for the JSON output. Luckily this can be altered on individual session level so robots and humans can even live peacefully side to side this time.
pg_show_plans.max_plan_length - to be by default light on the server resources EXPLAIN plan texts of up to 8kB (defined in bytes!) are only stored by default! So if having complex queries and seeing “” instead of plans, one could again opt to increase that value (1..100kB range) but bear in mind that this memory is reserved upfront for each connection slot (max_connections).
Now one can restart the PostgreSQL server and our extension is ready for usage.
Ok, so how to use this tool after we’ve installed and configured it? Well for those who have an abundance of well or “too well” loaded systems they can just take the last query below but for test purposes first I’ll first set up some test data to get a slowish query to kind of simulate real life conditions.
|
1 2 3 4 5 6 7 8 9 10 11 12 13 |
-- 1M pgbench_accounts rows pgbench -i -s10 --unlogged -- crunching through 1 trillion entries...should give us some days to react :) select count(*) from pgbench_accounts a join pgbench_accounts b on b.aid = b.aid; -- from a new session: -- before the first usage of pg_show_plans we must first load the extension CREATE EXTENSION pg_show_plans; -- now let's diagnose the problem… -- note that this pg_backend_pid() is not really mandatory but we don’t want to see -- our own mini-query usually, we’re looking for bigger fish SELECT * FROM pg_show_plans WHERE pid != pg_backend_pid(); |
And the output that should help us understand the reasons for slow runtime:
| pid | 20556 |
| level | 0 |
| userid | 10 |
| dbid | 13438 |
| plan | Aggregate (cost=17930054460.85..17930054460.86 rows=1 width=8)
-> Nested Loop (cost=0.85..15430054460.85 rows=1000000000000 width=0) -> Index Only Scan using pgbench_accounts_pkey on pgbench_accounts a (cost=0.42..25980.42 rows=1000000 width=0) -> Materialize (cost=0.42..33910.43 rows=1000000 width=0) -> Index Only Scan using pgbench_accounts_pkey on pgbench_accounts b (cost=0.42..25980.42 rows=1000000 width=0) |
Ouch, a typo in the join condition...who wrote that? Better terminate that query….
In practice to make the output even more usable one might want to add also some minimum runtime filtering and instead of userid / dbid show real names - looking something like that:
|
1 2 3 4 5 6 7 8 9 10 11 12 13 |
select pg_get_userbyid(userid) as 'user', now() - query_start as duration, query, plan from pg_show_plans p join pg_stat_activity a using (pid) where p.pid != pg_backend_pid() and datname = current_database() and now() - query_start > '5s'::interval order by duration desc limit 3; |
As all extra activities inside the database have some kind of cost attached to them, a valid question would be - how “costly” it is to enable this extension and let it monitor the query “traffic”? Well, as so often in tech - it depends. On the busyness of your server i.e. how many concurrent queries are running and how long are they on average. For very parallel and short statements (<0.1ms) there’s indeed a penalty that one can notice ~ 20% according to my measurements with “pgbench” using the “--select-only” to get the micro-transactions. But for normal, more slowish real life queries the performance hit was small enough to be ignored. But in short - if having mostly very short queries, de-activate the extension by default (pg_show_plans_disable function) and then enable only when starting some kind of debugging sessions via the pg_show_plans_enable function.
The code was implemented by one of our PostgreSQL core hackers Suzuki Hironobu, who in turn was inspired by the existing pg_store_plans extension, so some credit is surely due to those fellas. Thanks a lot for making PostgreSQL better! Although it’s not something you’ll need every day, it’s something that advanced users look for and might select or ditch certain products because of that. Oracle for example has also had something similar available (v$sql_plan, v$sql_plan_monitor views) for some time, so a very welcome addition indeed.
As you saw - pg_show_plans is a very nice addition to PostgreSQL’s troubleshooting toolkit and simple enough to be used both by DBA-s and developers. It supports all remotely recent PostgreSQL versions and the best part - it’s Open Source under the PostgreSQL licence! Take it and use it however you see fit...but as always, we would of course be thankful for any kind of feedback, to improve this extension further.
GitHub project page here.
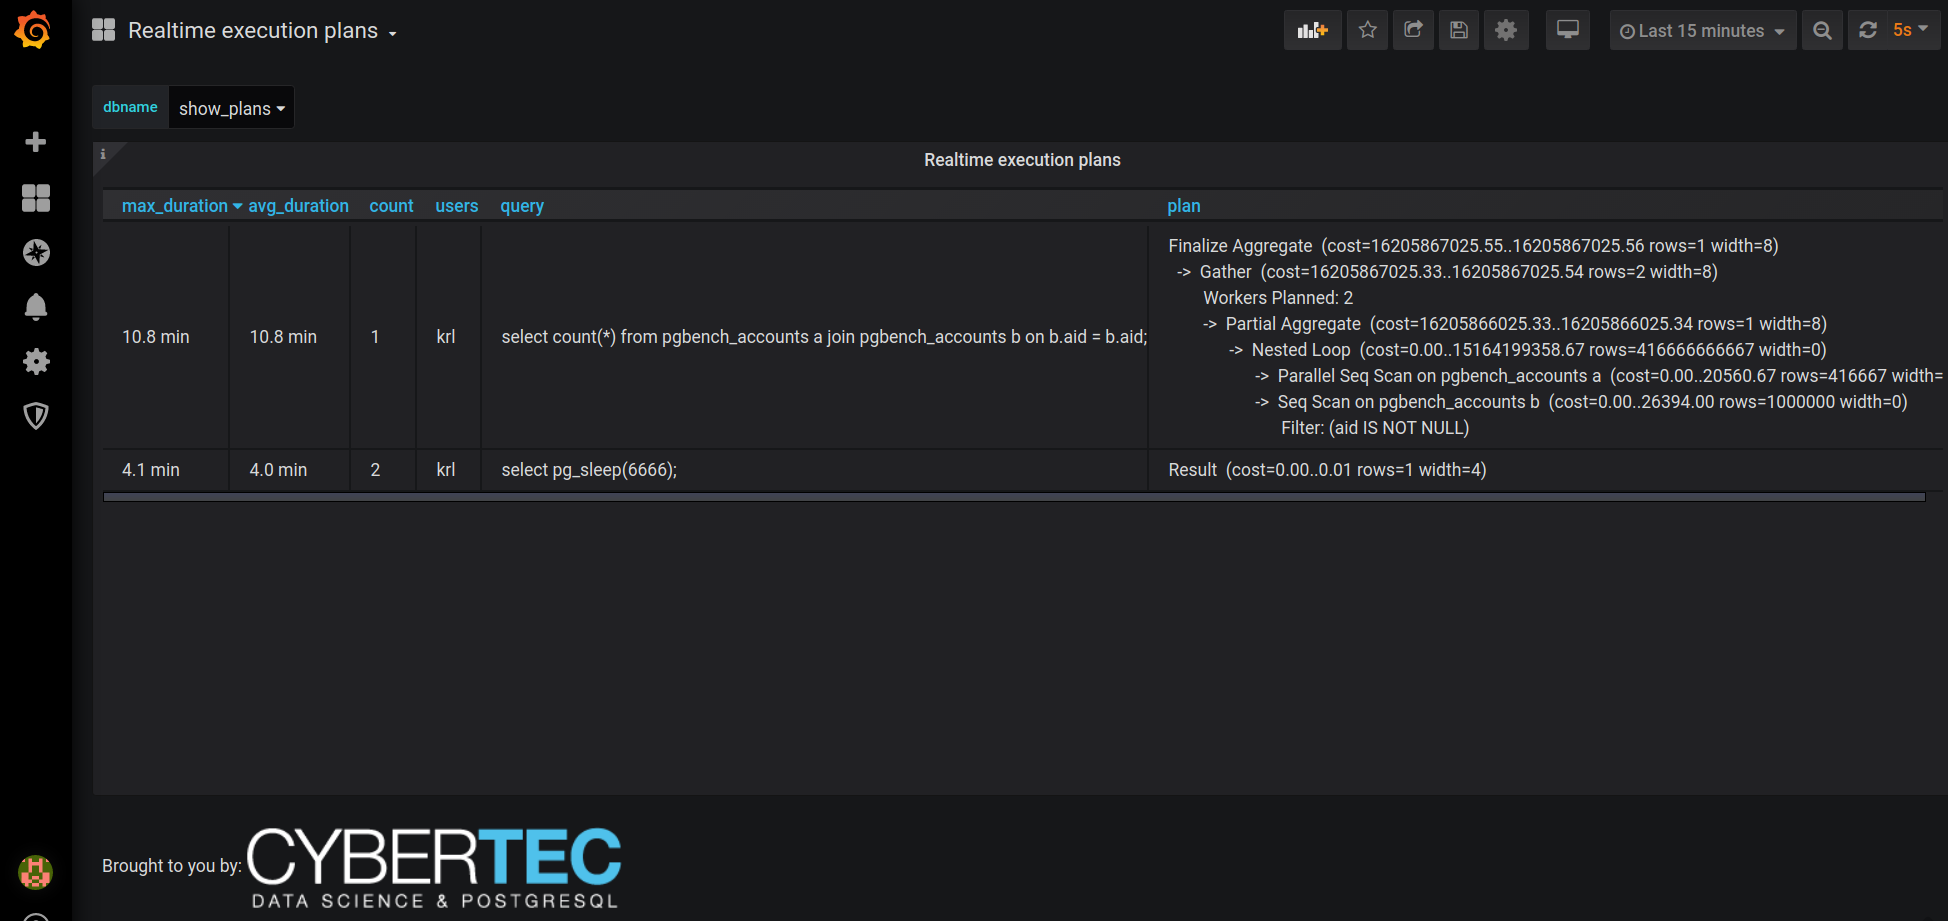
Also maybe good to know - our PostgreSQL monitoring tool of choice, pgwatch2, also has built-in support for this extension in real-time mode so you can easily display live EXPLAIN plan info for long-running queries nicely on a Grafana dashboards! A sample here:
In order to receive regular updates on important changes in PostgreSQL, subscribe to our newsletter, or follow us on Twitter, Facebook, or LinkedIn.
+43 (0) 2622 93022-0
office@cybertec.at
You need to load content from reCAPTCHA to submit the form. Please note that doing so will share data with third-party providers.
More InformationYou are currently viewing a placeholder content from Facebook. To access the actual content, click the button below. Please note that doing so will share data with third-party providers.
More InformationYou are currently viewing a placeholder content from X. To access the actual content, click the button below. Please note that doing so will share data with third-party providers.
More Information
Great stuff. The functionality is immensely useful for examining slow queries. There is a script to print the plan of a running PostgreSQL query available at https://github.com/StarfishStorage/explain-running-query
Still, I think that creating an extension is a step in the right direction. Ideally, the extension should be included in PostgreSQL repos.