Spatial Tile Serving with PostgreSQL Functions
In my previous posting on tile serving, I demonstrated how pg_tileserv can publish spatial tables as dynamic vector tiles.
Dynamic tiles, available as part of Crunchy Spatial, are generated in the database, on-the-fly, in response to a tile request. This allows for two kinds of dynamism to show up in the end user applications:
- Changes in the underlying data show up in the generated tiles.
- Changes in the tile request can show up in the generated tiles.
The first kind of dynamism is easy to exercise: connect to your database and edit your data, and the tiles will reflect the changes.
The second kind of dynamism requires a way to receive custom request parameters and use them in the tile generating query.
So each dynamic tile set requires a name, and a set of input parameters, and SQL that uses those parameters. Fortunately, PostgreSQL already has a mechanism for defining such thing: custom user functions!
Simple Filter Function
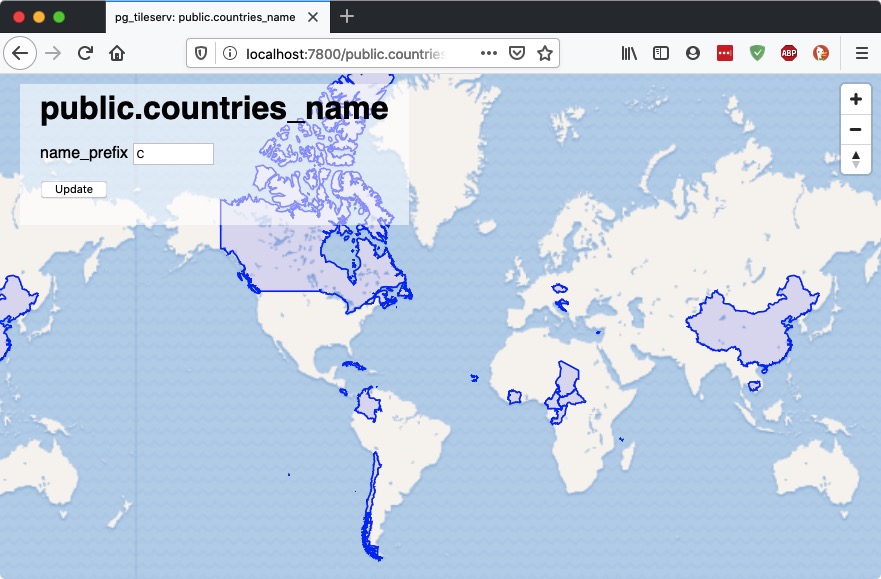
For example, here is a function that allows the end user to filter the "ne_50m_admin_0_countries" table we used in the previous example of tile serving.
-- The function requires z/y/x tile address parameters
-- and then whatever other user parameters you need.
-- Be sure to name them, and provide a default
-- value!
-- This function filters out the countries table to
-- only return those countries that start with the
-- user-provided prefix characters.
CREATE OR REPLACE
FUNCTION public.countries_name(
            z integer, x integer, y integer,
            name_prefix text default 'B')
RETURNS bytea
AS $$
   -- Convert tile coordinates to a bounding box
   WITH
   bounds AS (
   SELECT ST_TileEnvelope(z, x, y) AS geom
),
   -- Convert raw geometry into MVT geometry
   -- Pull just the name in addition to the geometry
   -- Apply the name_prefix parameter to the WHERE clause
   mvtgeom AS (
      SELECT ST_AsMVTGeom(ST_Transform(t.geom, 3857), bounds.geom) AS geom,
        t.name
      FROM ne_50m_admin_0_countries t, bounds
      WHERE ST_Intersects(t.geom, ST_Transform(bounds.geom, 4326))
      AND upper(t.name) LIKE (upper(name_prefix) || '%')
    )
    -- Serialize the result set into an MVT object
    SELECT ST_AsMVT(mvtgeom, 'public.countries_name') FROM mvtgeom;
$$
LANGUAGE 'sql'
STABLE
PARALLEL SAFE;
Add this function to your database and you can see it in the service browser, change the input parameter, and see the output tiles change in response.
Geometry Generating Function
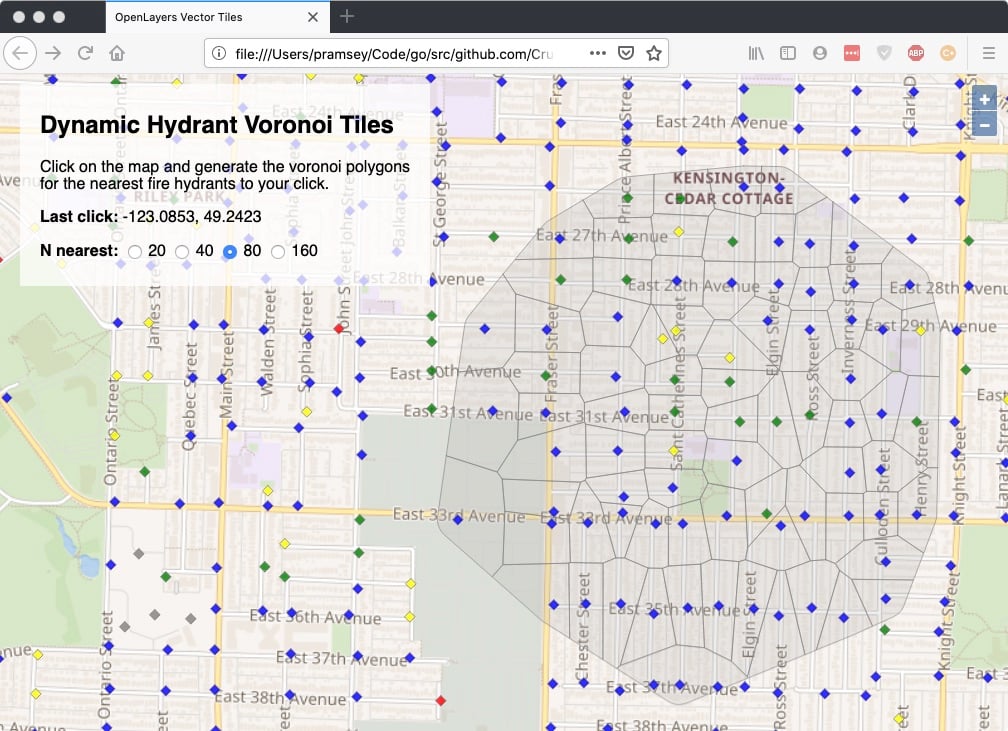
This example takes in user input, in the form of a map click, and generates outputs using that click to drive the query.
Start by downloading the "fire hydrant data" as a shape file from the City of Vancouver open data site.
Load the data into your PostgreSQL/PostGIS database with shp2pgsql:
shp2pgsql -s 26910 -D -I water-hydrants.shp hydrants | psql postgisftw
Now you have a hydrants table, and you can build geometries against that table.
Now we need a function that takes in a click, and a count (N) of hydrants to process, it will
- Find the nearest N hydrants to the click point,
- Build a voronoi diagram around those hydrants,
- Clip the diagram to the convex full of the N hydrants, and
- Return the result as a vector tile.
The function signature looks like this:
CREATE OR REPLACE
FUNCTION public.hydrants_voronoi(
            z integer, x integer, y integer,
            lon float8 default -123.129,
            lat float8 default 49.253,
            count bigint default 0)
RETURNS bytea
...
The full function definition is available here:
Load the function into your database. Refresh the server catalog by hitting the root metadata or HTML URL (http://localhost:7800/index.html). The function signature provides a definition that is exposed using JSON metadata.
{
	"minzoom": 0,
	"maxzoom": 22,
	"id": "public.hydrants_voronoi",
	"name": "hydrants_voronoi",
	"schema": "public",
	"arguments": [
		{
			"type": "double precision",
			"name": "lon",
			"default": "-123.129"
		},
		{
			"default": "49.253",
			"type": "double precision",
			"name": "lat"
		},
		{
			"name": "count",
			"type": "bigint",
			"default": "0"
		}
	],
	"tileurl": "http://localhost:7800/public.hydrants_voronoi/{z}/{x}/{y}.pbf"
}
Web User Interface
The web user interface for this example uses the OpenLayers Javascript web map library. The full HTML page is available here:
Some items of note in the example.
var voronoiFunction = "public.hydrants_voronoi";
function voronoiUrl(x, y, count) {
   var url = vectorServer + voronoiFunction + "/{z}/{x}/{y}.pbf"
   if (count < 1) { return url; }
   var data = "?lon="
            + x + "&lat="
            + y + "&count=" + count;
   return url + encodeURI(data);
}
The URL for the voronoi vector layer includes client-side controlled values for the click coordinate (lon/lat) and for the number of voronoi polygons to be returned (count).
// Dynamic style for hydrant points.
// Depending on the value of the 'color' property returned
// by the server, the points are assigned a different color.
// Depending on the current zoom value of the map, the
// point makers are given a different size.
// To avoid performance issues of repeatedly generating
// the same style, combinations of zoom/color are cached
// in a dictionary. var hydrantStyleCache = {};
var hydrantStyle = function (f) {
	var alpha = 0.8
	var zoom = map.getView().getZoom()
	var clr = f.get('color')
	clr = clr && clr.length ? clr.toLowerCase() : 'grey'
	var k = zoom + clr
	var s = hydrantStyleCache[k]
	if (!s) {
		s = new ol.style.Style({
			image: new ol.style.RegularShape({
				fill: new ol.style.Fill({ color: setAlpha(clr, alpha) }),
				stroke: new ol.style.Stroke({
					color: setAlpha('grey', alpha),
					width: 1,
				}),
				points: 4,
				radius: 2 + (zoom < 12 ? 0 : zoom - 12),
				angle: 0,
			}),
		})
		hydrantStyleCache[k] = s
	}
	return s
}
The style for the hydrants layer dynamically reads the color values from the feature properties, and resizes the markers based on the zoom level.
// ----------------------------------------------------------------------
// Mouse hover action for all vector features on the map
// ----------------------------------------------------------------------
var info = document.getElementById('info')
map.on('pointermove', function showInfo(event) {
	var features = map.getFeaturesAtPixel(event.pixel)
	if (features.length == 0) {
		infotext.innerHTML = ''
		info.style.opacity = 0
		return
	}
	var properties = features[0].getProperties()
	infotext.innerHTML = props2html(properties)
	info.style.opacity = 1
})

// Convert properties to HTML table
function props2html(props) {
	var html = '<table>'
	for (var item in props) {
		html += '<tr>'
		html += '<th>' + item + '</th>'
		html += '<td>' + props[item] + '</td>'
		html += '</tr>'
	}
	html += '</table>'
	return html
}
A pointer move action tracks when the cursor is over a vector layer feature, and returns the properties for the first feature found, to be put into a live display. This makes exploring the features of the map more dynamic than clicking on features, and is an example of the kind of client-side features that vector tiles make possible.
