
A flamegraph generator for Postgres EXPLAIN ANALYZE output.
Try the demo here.
You can install via Homebrew with the follow command:
$ brew install mgartner/tap/pg_flame
Download one of the compiled binaries in the releases
tab. Once downloaded, move
pg_flame into your $PATH.
Alternatively, if you'd like to use Docker to build the program, you can.
$ docker pull mgartner/pg_flame
If you'd like to build a binary from the source code, run the following commands. Note that compiling requires Go version 1.13+.
$ git clone https://github.com/mgartner/pg_flame.git
$ cd pg_flame
$ go build
A pg_flame binary will be created that you can place in your $PATH.
The pg_flame program reads a JSON query plan from standard input and writes
the flamegraph HTML to standard ouput. Therefore you can pipe and direct input
and output however you desire.
$ psql dbname -qAtc 'EXPLAIN (ANALYZE, BUFFERS, FORMAT JSON) SELECT id FROM users' \
    | pg_flame \
    > flamegraph.html \
&& open flamegraph.htmlCreate a SQL file with the EXPLAIN ANALYZE query.
-- query.sql
EXPLAIN (ANALYZE, BUFFERS, FORMAT JSON)
SELECT id
FROM users
Then run the query and save the JSON to a file.
$ psql dbname -qAtf query.sql > plan.jsonFinally, generate the flamegraph HTML.
$ cat plan.json | pg_flame > flamegraph.html
If you've followed the Docker installation steps above, you can pipe query plan JSON to a container and save the output HTML.
$ psql dbname -qAtc 'EXPLAIN (ANALYZE, BUFFERS, FORMAT JSON) SELECT id FROM users' \
    | docker run -i pg_flame \
    > flamegraph.html
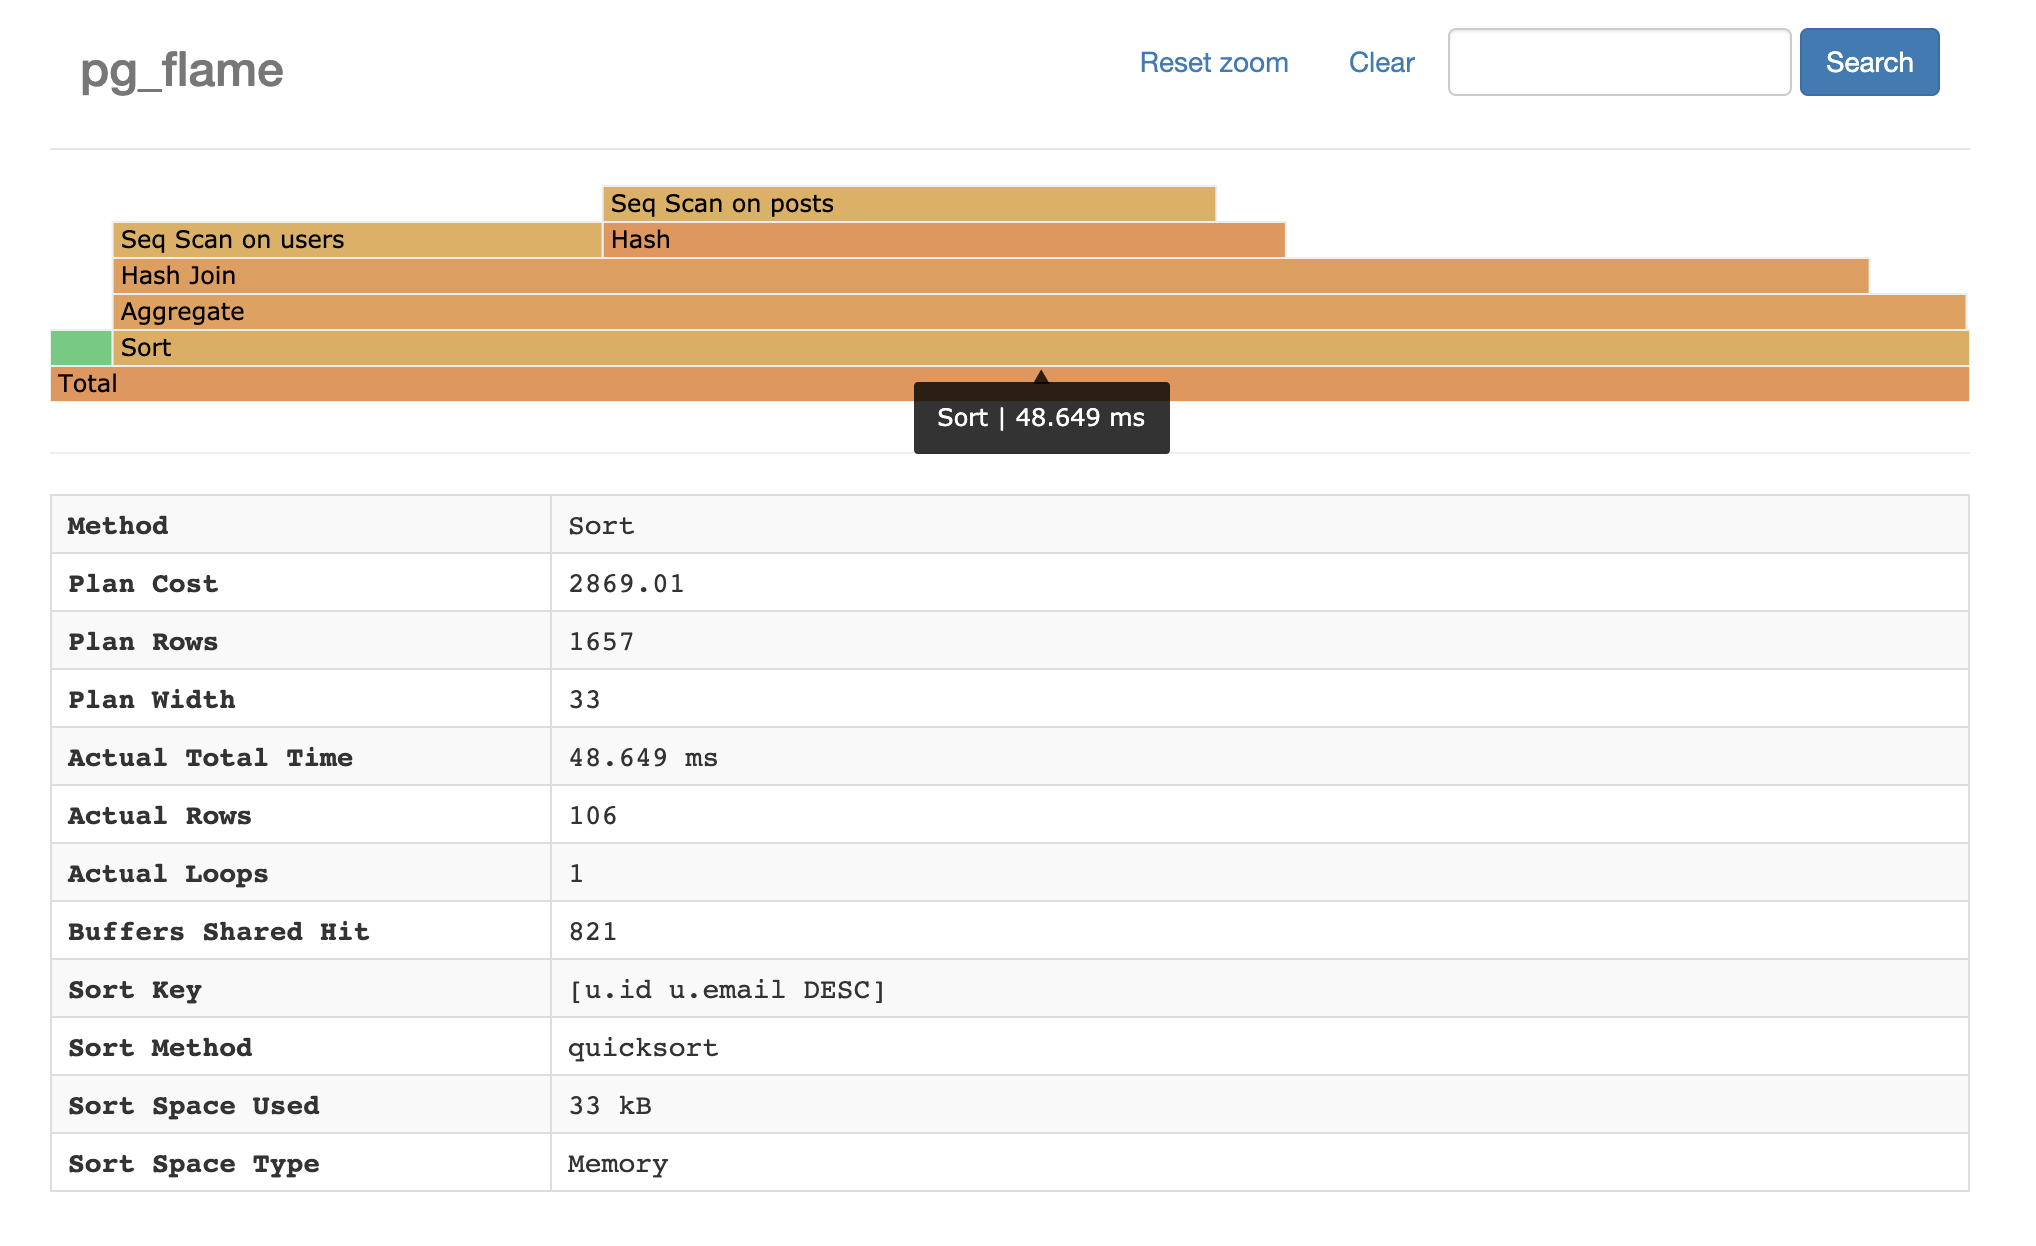
Flamegraphs were invented by Brendan Gregg to visualize CPU consumption per code-path of profiled software. They are useful visualization tools in many types of performance investigations. Flamegraphs have been used to visualize Oracle database query plans and query executions , proving useful for debugging slow database queries.
Pg_flame is in extension of that work for Postgres query plans. It generates a visual hierarchy of query plans. This visualization identifies the relative time of each part of a query plan.
This tool relies on the
spiermar/d3-flame-graph plugin to
generate the flamegraph.