It's been exactly half a year since the last major release of the pgwatch2 Open Source PostgreSQL monitoring tool, and I'm glad to announce that another huge set of useful features and improvements have found their way into the pgwatch2 code repository! The new version is incremented to v1.7 and, continuing the naming tradition, I'm also calling it "Feature Pack 6" as it's mostly about new features mixed with some bugfixes, although it's been surprisingly error-free for the last year. Note that listed below are only the most significant changes since last major version, v1.6, so please go through the GitHub changelog in detail if you're upgrading from a previous version.
Table of Contents
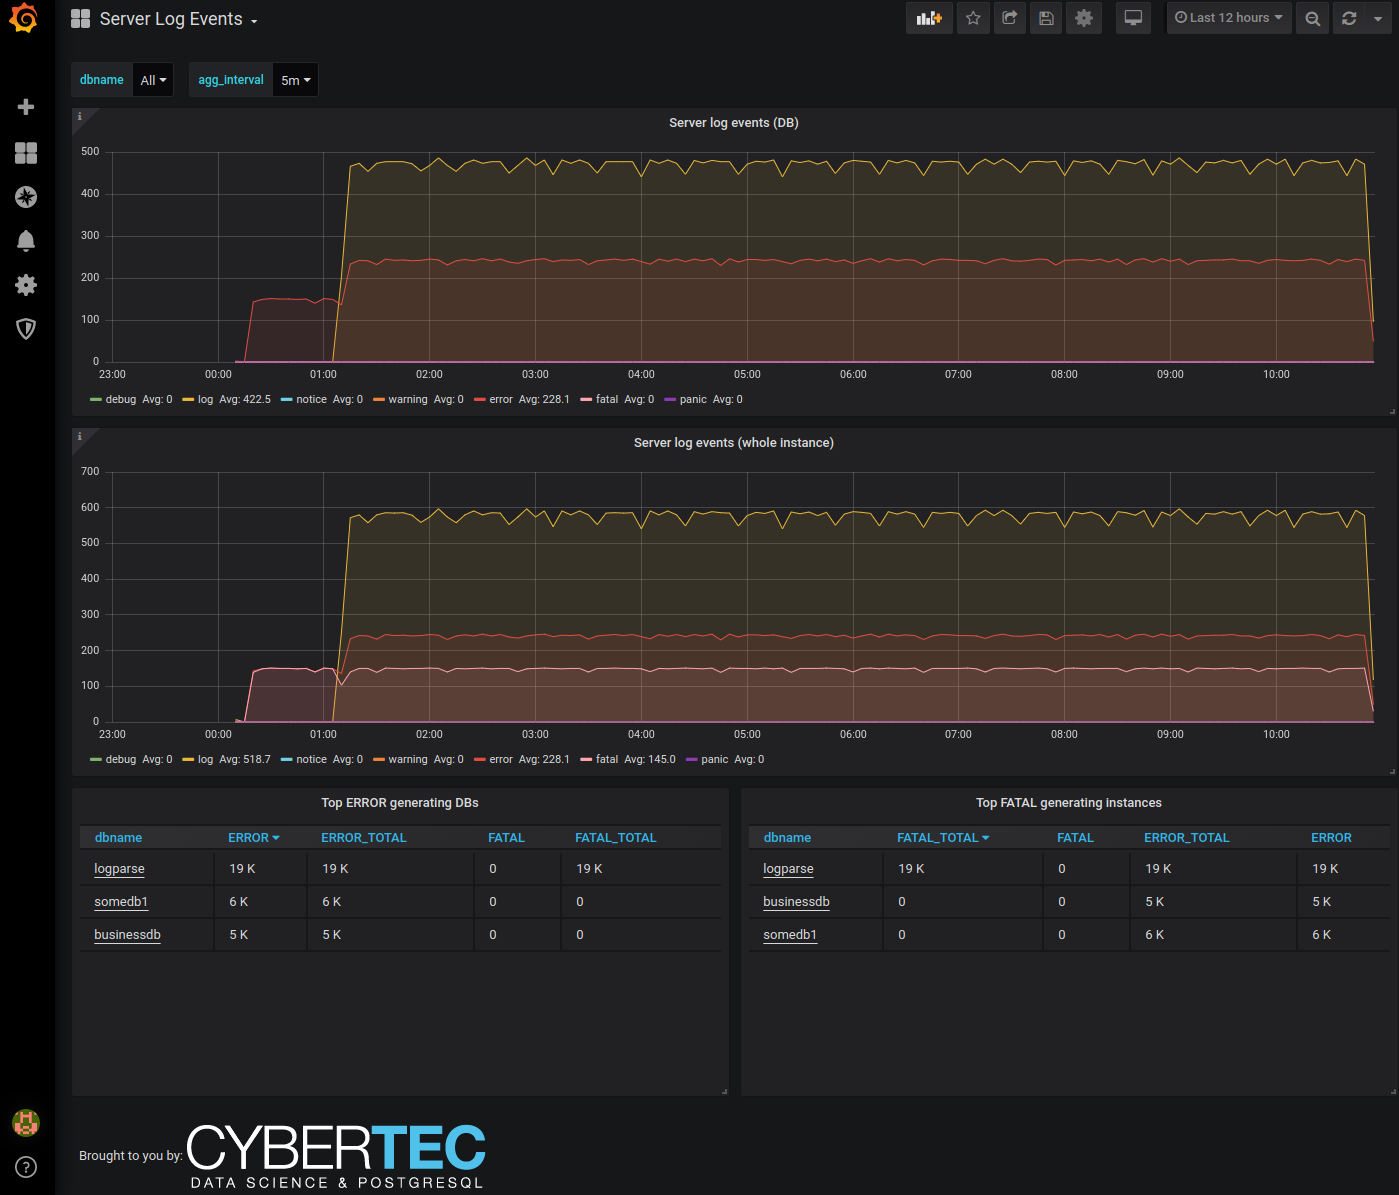
The biggest feature for me is the log parsing support. This means that when the pgwatch2 agent is deployed locally on the DB server (also called in "push" mode), it can "tail" the logs and send event counts to the metric store. And when is that useful? Well, mostly for all alerting and health-check purposes. Note that we're not storing error message contents to avoid security and performance problems, but only the event counts, grouped by severity.
Other notable features are the "recommendations engine" and some infrastructure changes to treat metrics with "real-time" in their name a bit differently so that they could be executed very often (every second even) thus providing a near real-time glimpse into database activities, with the main practical usage of tracking live (currently executing) server processes conveniently there where all other metrics are viewed - in Grafana. Also included is possible locking info, utilizing "pg_stat_activity" and "pg_locks" data. But not only that – also for example live "explain plan" tracking for longer-lasting queries is now possible.
And as always, please do let us know on GitHub if you’re still missing something in the tool or are experiencing any operational difficulties - any feedback would be highly appreciated!
* New feature - server log parsing
Logs are continuously parsed for errors, warnings, etc and these counts are regularly sent to the metric store. Assumes that the pgwatch2 collector is set up locally and has access to the log file folder – paths are auto-detected when sufficient privileges are there. Note that out-of-the-box it only works in conjunction with the CSVLOG log format (which is actually the best format if you don't plan to log absolutely all queries, events, etc as it can generate quite some volume then) – if you're not using that you need to provide a customized regex in Golang syntax.
* New feature - recommendations engine
Some new metrics and a dashboards to list some common "best practice" violations like: too many superusers for possible threats, overly long-running queries, possible autovacuum issues, "untightened" security definer functions, "untightened" public schemas, unused indexes, too deeply nested views and also possibly missing indexes! The latter is based on the pg_qualstats extension which needs to be installed / configured independently on all target databases. But as the object of the recommendations / opinions is to allow that everyone to have their own view, the system is set up so that these recommendations can easily be extended / changed via SQL (as with normal metrics).
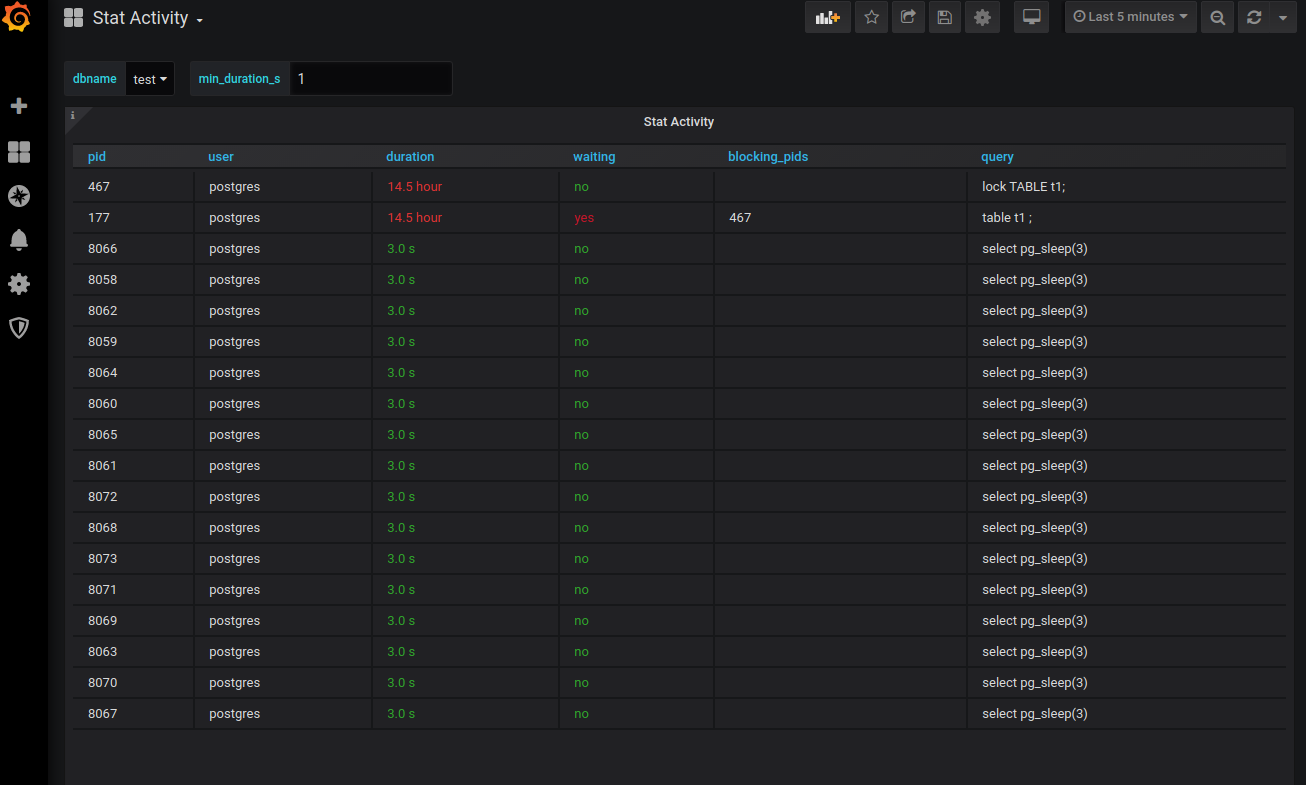
* New feature - real-time session activity monitoring via Grafana
Well, near-real-time of course, as active session data (based on pg_stat_activity with additional locking info) first needs to be sent to the metric store and only then it's selected from Grafana as usual. But there are some optimizations on the storage level (unlogged tables, short partitions) so it should be fine with intervals in seconds. Note that as it still can be quite a "costly" feature, it's not included in the default "preset configs" and needs to be enabled separately – according metric is called "stat_activity_realtime". See below for a picture of the new dashboards.
* New "Postgres Version Overview" dashboard
Show the current PostgreSQL version for all monitored DBs, highlighting versions that are too old and out of the official support window. See below for a picture.
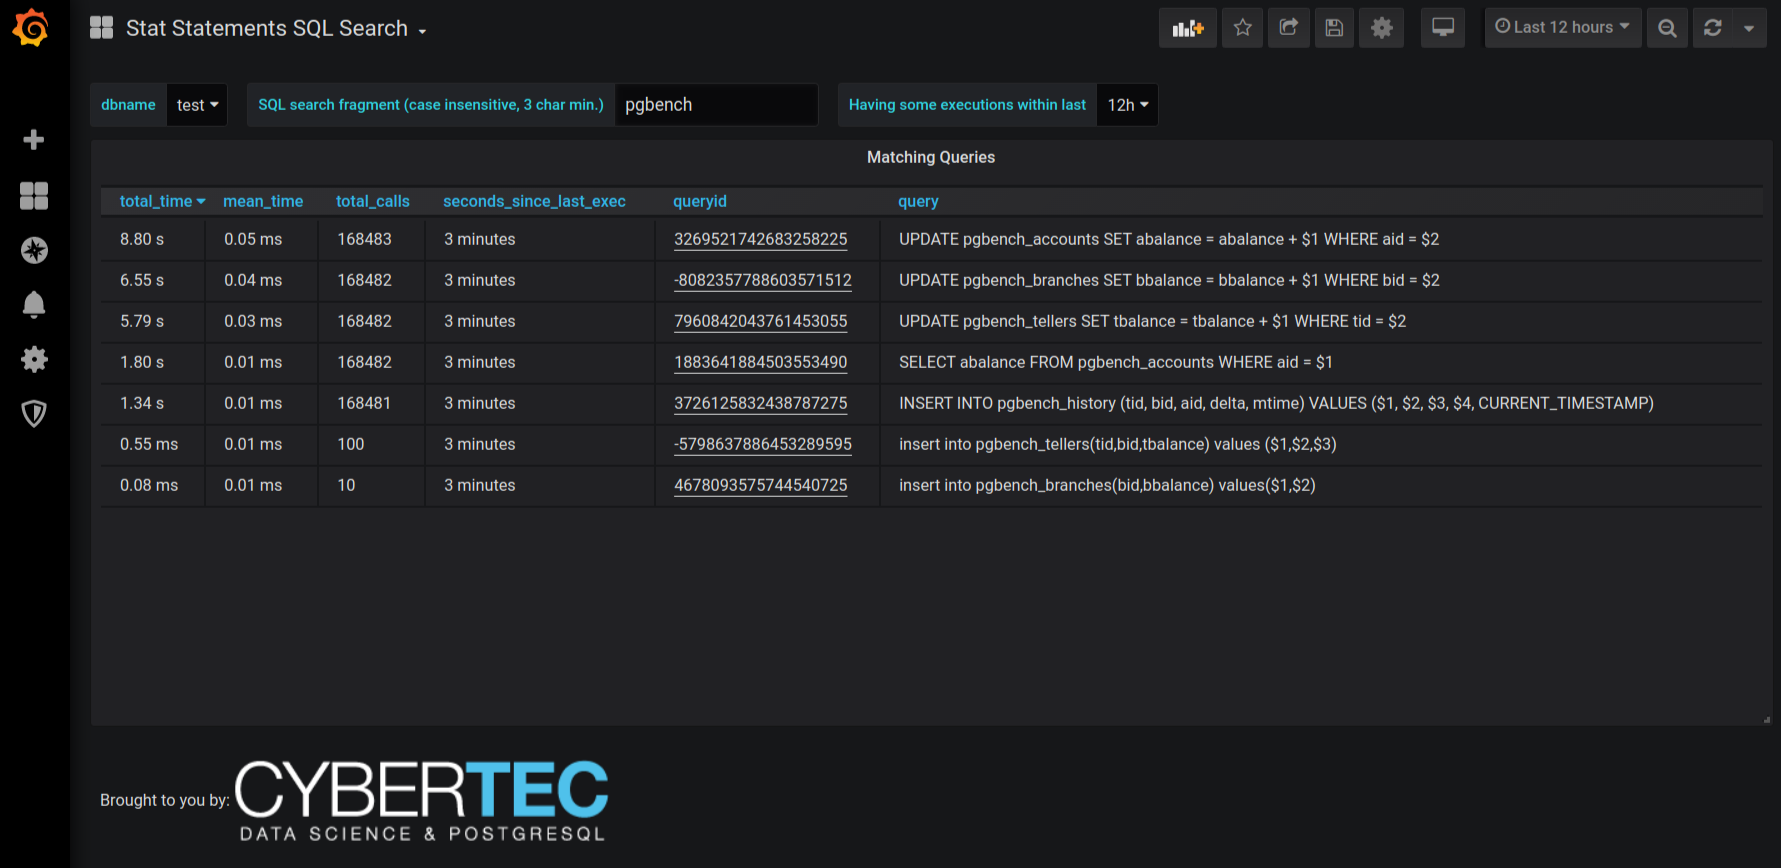
* New "Stat Statements SQL Search" dashboards
Shows execution statistics (runtime, calls, mean time) for queries matching some user-inputted SQL fragments. Note that this requires the "stat_statements" metric to be enabled and also remember that by default pgwatch converts queries to lower case and cuts off the end if it's more than 16k chars. See below for a picture.
* Make pgwatch2 "superuser" aware
As of now,for some metrics there are defined "direct access SQL-s" that superusers / pg_monitor roles can use so that less helper / wrapper functions are required for example if you're doing a local setup where the collector runs on the database server.
* Gatherer improvement - support password/cert authentication for Patroni and etcd
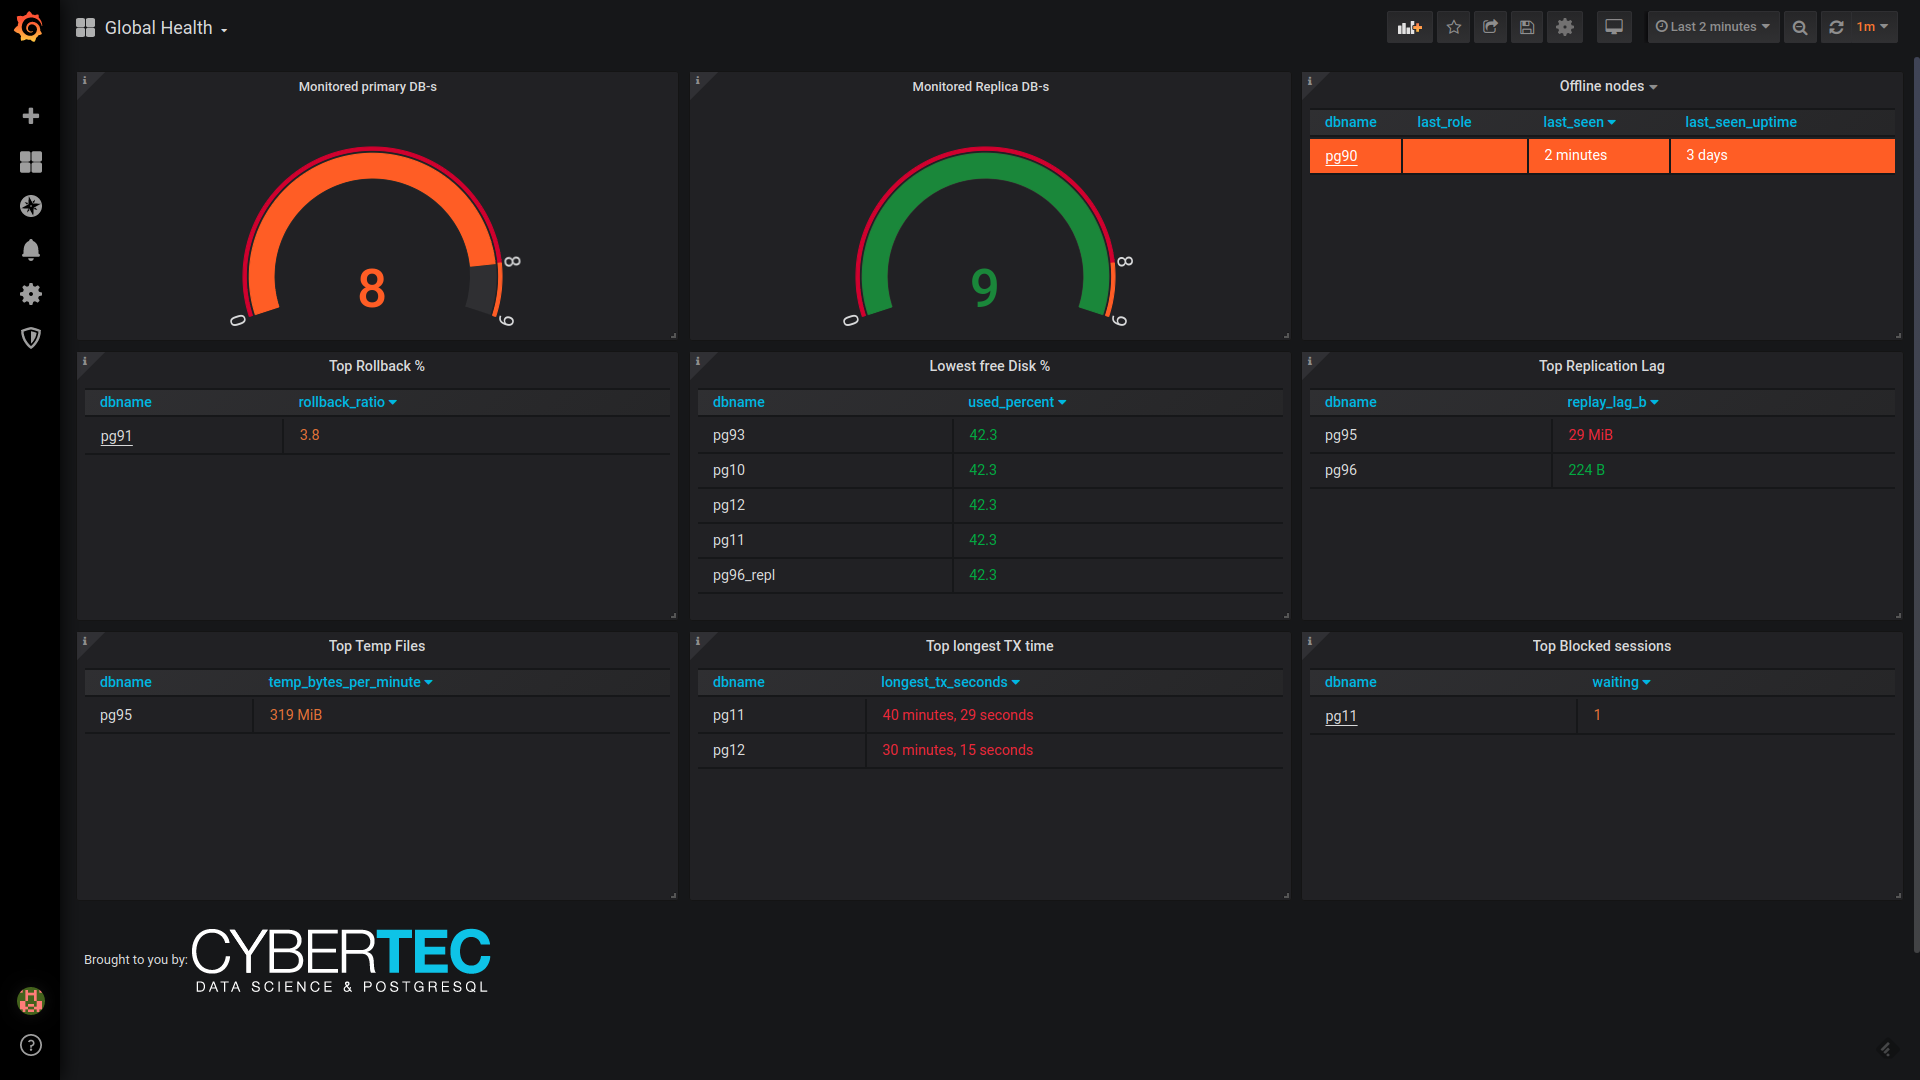
* Gatherer improvement – sync list of monitored DBs back to metric store regularly
This means that the list of configured to-be-monitored DBs data is also present together with normal metrics data so that one can easily create downtime checks without cross-checking with the config DB / YAML files. See the "Global health" dashboard for a sample implementation (for Postgres metric store only).
* Phase out Python 2 in favor of Python 3, since the former is already officially EOL
If Python 2 is still required users need to replace the "plpython3u" line with "plpythonu" in metric fetching helpers.
* Added a HELM chart to deploy pgwatch2 easily on Kubernetes
* New "ping" mode to quickly check connectivity to all DBs.
Use the gatherer "--ping" flag to see that all configured (to be monitored) DB-s are reachable. No metrics are collected, and the program exits after these connection checks.
* Usability – schema and dashboard rollout scripts
Rolling out the Config DB or Metrics DB schema or importing all pgwatch2 Grafana dashboards are now one-liners. Also the ready-made RPM / DEB / Tar packages now include the Grafana dashboards, so no internet connection is required after installing the packages.
* Usability - filter out pgwatch2 generated metric fetching queries in Stat Statements Top
This means it's easier to detect expensive "real" queries, coming from the users. For mostly idle systems it can actually happen that monitoring queries are the top time consumers. This behaviour can be also changed via a dropdown on the dashboard.
pgwatch2 is constantly being improved and new features are added. Learn more >>
Global instances health overview
SQL search based on Stat Statements data
+43 (0) 2622 93022-0
office@cybertec.at
Hello Kaarel,
Today I gone through pg_show_plans feature from CyberTec.As per blog, it says that pg_show_plans is already covered in pgwatch2. I checked it in pgwatch 1.7.2, however I didn't find it in pgwatch2. Could you please share in which dashboard this feature is covered ?
Thanks
Darshan Shah
It's called "Show EXPLAIN plans realtime" and looks like that but currently it's only defined for Postgres data sources. Also as it's quite invasive and you need an extension on the monitored DB as well it's not part of the default config but you need to explicitly enable the "show_plans_realtime" metrics.
Hello Kaarel,
I have installed pgwatch 1.7.2 however I didn't see that dashboard. On demo site I can see it. Could you please provide version number under which this feature is available?
thanks
Darshan Shah
"currently it's only defined for Postgres"...maybe you launched the InfluxDB image? You need "pgwatch2-postgres"
ok. Thanks
Hello Kaarel,
I have set up new version of pgwatch2 1.7.1 on docker and configured metric Stat activity realtime. Still I can not get any details on grafana dashboard. I do not find any error in any log of pgwatch2.

any thing I missed ?
Hi! You F5 refreshed the page still, right? Just pressing the Grafana refresh button is not enough. If yes, then I guess that something still went wrong with the configuration - there are no hosts with such metrics collected as the dropdown is empty. But please use Github for such future technical issues
Hello Kaarel,
I see pg_qualstats is very good option for index suggestions. However is it preferable for production as per performance point of you ?
A good question...but hard to answer. As always performance depends on so many factors (hardware, OS, PG settings, types of queries, system load) that the only reliable way is to test on your plartform. I've never had any performance problems though with pg_qualstats and also this blogpost says the impact is negligible - https://www.percona.com/blog/2019/07/22/automatic-index-recommendations-in-postgresql-using-pg_qualstats-and-hypopg/