AWS Database Blog
Achieve up to 17x lower replication lag with the new write-through cache for Aurora PostgreSQL
Amazon Aurora PostgreSQL-Compatible Edition recently added the logical replication write-through cache. The logical replication write-through cache helps improve performance by reducing the amount of Aurora storage I/O that takes place during logical decoding. When you use the write-through cache, the logical decoder looks in the cache first for data to satisfy queries; if the data is found, it is returned directly from the cache. By reducing the amount of storage I/O, the default write-through cache realizes an improvement of up to 17x in replication lag with a pgbench workload without a drop in Transactions Per Second (TPS). In this post, we show you how to monitor and tune the write-through cache so your cluster realizes the full benefits of the cache.
Logical Replication Overview
Logical replication is a publication/subscriber capability that provides fine-grained control of replication for Aurora PostgreSQL clusters. An Aurora PostgreSQL cluster can use logical replication to perform a logical export of data to take advantage of managed services like AWS Database Migration Service (AWS DMS), Amazon Kinesis, and others. With Aurora PostgreSQL versions 11.17, 12.12, 13.8, and 14.5, a new feature is provided that improves performance for workloads that rely on Aurora PostgreSQL logical replication. This performance improvement is implemented via a write-through cache specifically designed to improve the latency of logically replicated data to clients. The goal of the cache is to decrease latency and reduce the CPU overhead of PostgreSQL logical replication.
Logical replication in PostgreSQL works by decoding the write-ahead log (WAL) into a stream of records that can be consumed by the subscriber. When you configure logical replication, you specify a replication slot name and decoding plugin type of each replication slot. The decoding plugin type determines the encoding used when streaming records to logical replication subscribers. Without caching, data changes must be fetched from Aurora storage, even if they were just recently written, which consumes I/O and increases resource contention on the writer instance.
If you have a continuous-sync workload (like a CDC stream or an asynchronous reader) paired with Aurora PostgreSQL logical replication, you can benefit by using the write-through cache. In a continuous-sync workload, the replication consumer is continuously streaming from the database and needs low-latency access to the most recently committed data. This recency bias allows Aurora to pull data from the write-through cache without significant replication lag; the amount of memory available to the cache is controlled by the rds.logical_wal_cache parameter.
In the following sections, we show you how to monitor and tune the write-through cache to achieve a logical replication performance improvement.
Improved performance
The following examples show the type of performance improvements that the write-through cache can provide for different types of workloads and cache configurations. For consistency and accuracy, data was gathered using a custom-written tool to directly measure replication latency.
Decreased replication lag
If a replication stream is generated too rapidly for an instance to keep up, the replica falls behind; this is replication lag. The default write-through cache realizes a 44% improvement in replication lag over the last release of Aurora PostgreSQL. Increasing the write-through cache size to 2 GB improves the replication lag even more, to 59%.
In the following graph, the left-most bar shows the replication lag in a cluster that isn’t using the write-through cache. The middle bar represents the improvements to the lag in a cluster that is using the default cache size (16 MB); the right-most bar represents the improvements seen when the same cluster uses a custom-tuned cache size (2 GB).

Improved transaction processing time
The following graph shows the performance improvement when processing a mixed workload (a workload made up of large and small transactions). In an instance with default cache settings (16 MB), the number of replicated rows per second (measured at the replication consumer) improved by 161%; when the cache was increased to 2 GB, replication throughput improved by up to 185%.

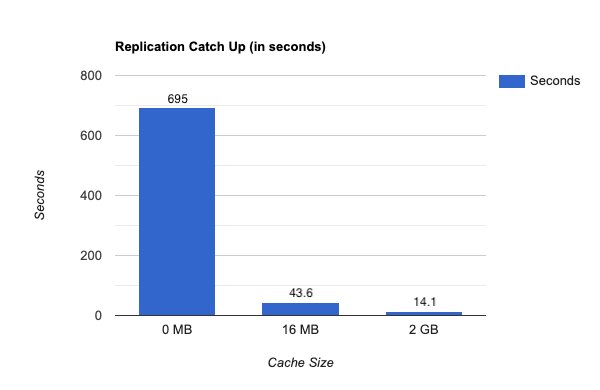
Improved transaction catch-up time
The replication catch-up time improves in the scenario where new transactions cease and the replication slot needs to catch-up. With the cache turned off, the remaining write transactions took over 695 seconds (11 and a half minutes) to be replicated. With the cache turned on and set to default settings, the same set of remaining write transactions took 43 seconds to catch up (an improvement of 93.7%). A larger cache size shows even more significant improvement, with the writes taking 14 seconds (an improvement of 97%), as shown in the following graph.
Reduced read I/O
When selecting a cache size, you should bear in mind that the mix of transactions that you typically process can impact how much of a reduction in read I/O you will see. In the following graph, the blue bars represent a workload made up of primarily large data transactions. For large data transactions, an increased write-through cache size (2 GB) can lead to a dramatic reduction in read I/O.
The orange bars in the graph represent a combined workload (made up of a mix of large data and pgbench transactions). With a combined workload, the default configuration sees a 47% improvement in read I/O when compared to an instance with caching disabled. If you increase the cache size to 2GB, read I/O decreases even more, running 71% faster.

If you’re having trouble with read I/O, or if your cache statistics are showing a high number of misses, you may want to evaluate your workload and increase your cache size accordingly.
Write-through cache management
In this section, we discuss managing the write-through cache behavior and monitoring.
Behavior
As write transactions are committed in an Aurora PostgreSQL cluster, the corresponding WAL records are written to both Aurora storage and the Aurora PostgreSQL WAL cache. If the cache is full (the size is defined by the rds.logical_wal_cache parameter), the oldest record in the cache is removed and the new record is appended to the end of the cache (typically referred to as a First-in, First-out, or FIFO queue).
If the write workload produces new records faster than they are consumed from a replication slot, the replication process starts reading WAL records from Aurora storage until they have caught up to the data available in the logical replication write-through cache.
There are a few things to keep in mind while monitoring and optimizing performance of the cache:
- If only one replication slot (of multiple) is falling behind, it’s likely due to a problem with availability or performance of the tool that is reading from the replication slot.
- If all replication slots are consistently falling behind, the cache may be too small. Consider increasing the
rds.logical_wal_cachevalue. - If all replication slots fall behind for a short period of time and then catch-up, it may be due to a large write transaction (a large number of rows with a high number of savepoints) that required extended processing. Consider monitoring for replication lag (as described below), and adjusting the transaction to act on a smaller set of rows or disable
SAVEPOINTutilization for that transaction.
Monitoring
The write-through cache is automatically enabled in Aurora PostgreSQL version 11.17, 12.12, 13.8, and 14.5 for clusters using logical replication. To turn off the write-through cache, modify your parameter group, setting the rds.logical_wal_cache parameter to 0.
Aurora PostgreSQL has three functions that you can use to evaluate and manage the write-through cache. You can use the aurora_stat_logical_wal_cache() function to return information about cache usage per slot. The function assesses the write-through cache usage to decide if it’s providing a performance benefit.
The command returns a SETOF record that contains the following:
name– The replication slot name.active_pid– Thewalsenderprocess.cache_hit– The total number of WAL cache hits since the last reset.cache_miss– The total number of WAL cache misses since the last reset.blks_read– The total number of WAL cache read requests.hit_rate– The WAL cache hit rate (cache_hit/blks_read).last_reset_timestamp– The last time Aurora reset the counter.
The following result set shows two replication slots with one being active. It shows good use of the write-through cache, with a 100% hit_rate on the cache buffers:
If your cache size isn’t sufficient to handle your cache usage, edit your parameter file to increase the wal_buffer size.
There are two more functions that you can use to help manage the logical replication write-through cache:
- Use the
aurora_stat_reset_wal_cache()function to reset the counter for theaurora_stat_logical_wal_cache()function. This function only works on the writer instance of your replication scenario. For more details, refer to aurora_stat_reset_wal_cache(). - Use the
get_oldest_wal_cache_ptr()function to return the oldest page in the logical WAL cache.
Summary
In this post we discussed the logical replication write-through cache for Amazon Aurora PostgreSQL. Logical replication can incur unwanted replication lag on your database; workload permitting, the logical replication write-through cache can help diminish that lag. Even if your configuration can sufficiently handle replication without incurring slowdowns, you can use the write-through cache to improve read performance for your cluster.
To get started, create or upgrade to an instance running Aurora PostgreSQL versions 11.17, 12.12, 13.8, and 14.5.
About the authors
 Susan Douglas has been a Developer Advocate for Amazon Aurora for nearly two years. Prior to joining AWS, she spent 20+ years writing about PostgreSQL and Linux, and consulting to PostgreSQL users. She shares a farm in central Virginia with her husband, horses, dogs, cats, and any other animal that needs a home.
 Scott Mead is a Database Engineer at AWS.