AWS Database Blog
A serverless architecture for analyzing PostgreSQL logs with pgBadger
PostgreSQL is one of the most popular open-source relational database systems. AWS offers services that make PostgreSQL database deployments easy to set up, manage, and scale in a cost-efficient manner. These services are Amazon Relational Database Service (Amazon RDS) for PostgreSQL and Amazon Aurora PostgreSQL-Compatible Edition.
Optimizing database performance is an important task for DevOps professionals. AWS provides tooling such as Amazon RDS Performance Insights and Amazon DevOps Guru for RDS to help with this task. The open-source community provides many options too, including the popular log analyzer pgBadger. pgBadger is an excellent tool for identifying both slow-running and frequently running queries and guiding you on how to improve their performance.
In a previous post, we demonstrated how to use infrastructure services to run pgBadger on Amazon Elastic Compute Cloud (Amazon EC2). In this post, we update the approach to run the analysis using a serverless stack. Akin to Performance Insights and Amazon DevOps Guru for RDS, this solution enables DevOps professionals to get enhanced insights into their database query performance without having to secure and patch compute instances or pay for underutilized resources. Serverless technologies feature automatic scaling, built-in high availability, and a pay-for-use billing to increase agility and optimize costs.
Overview of solution
There are five key non-functional requirements of the solution:
- It should be secure
- It should involve no persistent compute resources
- It should be fully automated
- It should assume nothing about the database except that the pgBadger logging parameters are set up and database logs are flowing to Amazon CloudWatch Logs
- pgBadger must work in incremental mode, thereby providing the ability to create incremental reports with successive runs of pgBadger
On that basis, we came up with the following tenets, which we used to guide our decision-making:
- Prefer private networking
- Prefer GA components
- Minimize custom coding
- Prefer serverless or managed services
- Prefer an event-driven architecture
You will see the use of these tenets as we explain the service and technology choices in the rest of the post.
The following diagram presents an overview of our approach.

The architecture consists of three main components:
- Producer – Amazon RDS is configured to send the database logs to CloudWatch Logs. Amazon Kinesis Data Firehose then buffers the data up to a configurable threshold and lays it down in an Amazon Simple Storage Service (Amazon S3) bucket, via an AWS Lambda transformation. When the object is sent to Amazon S3, S3 sends an event notification that places a message in an Amazon Simple Queue Service (Amazon SQS) queue. The queue is there to provide a buffer and prevent pressure building up between the producer side and the consumer side.
- Consumer – The queue is an event source for Lambda. Lambda then moves the object from Amazon S3 into its temporary storage, runs pgBadger, writes the output to Amazon Elastic File System (Amazon EFS), and cleans up.
- Presenter – pgBadger produces a report, which is a self-contained bundle of static HTML, JavaScript, and CSS resources, and can be served directly with Amazon S3 website hosting. AWS DataSync moves the data from Amazon EFS to Amazon S3.
Prerequisites
For this solution, you should have the following prerequisites:
- An RDS for PostgreSQL or Aurora PostgreSQL-compatible database with a parameter group configured with logging parameters for pgBadger
- An RDS for PostgreSQL or Aurora PostgreSQL-compatible database that publishes the PostgreSQL log to a CloudWatch Logs log group
- An Amazon Elastic Container Registry (Amazon ECR) repository, which holds the container image with pgBadger
- The ability to use Amazon Virtual Private Cloud (Amazon VPC) to create a VPC with at least a /26 CIDR capacity which ensures enough IP addresses to deploy across three availability zones.
- A development machine with Docker installed in order to build and deploy the provided container image with pgBadger.
The prerequisite architecture is shown in the following diagram, and the rest of this section discusses the prerequisites in more detail.

Set up the logging parameters for PostgreSQL
There are a number of parameters you can set to manipulate what appears in the PostgreSQL log. For more information, refer to Common DBA tasks for Amazon RDS for PostgreSQL and the Error Reporting and Logging. As with all observability solutions, the number of metrics reported, verbosity, and sampling frequency will have the largest influence on the variable costs of the solution. As you operate your database, you should tune these parameters to get the level of insight you require for the cost you’re prepared to pay. We show a breakdown of costs in a subsequent section.
The log is a place where sensitive data leakage can occur. This solution use Amazon KMS to encrypt the data at rest and pgBadger processing uses the –-anonymize flag to mask literal values in the reports.
Export the PostgreSQL log to CloudWatch Logs
Sending database logs to CloudWatch Logs is not the only way to access log events for Amazon RDS and Amazon Aurora. Logs are accessible straight from the database instances using the AWS API. All API methods that give access to Amazon RDS and Amazon Aurora log files have the potential to introduce an interruption in individual log entries. This is because of the relevant hard limits: the CloudWatch Logs event size is limited to 256 KB, and the Amazon RDS DownloadDBLogFilePortion is limited to 1 MB. In this case, a probable result of an interrupted log event entry in the log file is that pgBadger won’t be able to process that event. One of the factors that could guide decision-making here is the low likelihood of an individual log statement exceeding 256 KB against the higher likelihood of the log exceeding 1 MB in the rotation period. It’s a near certainty that a log line will be interrupted when downloading the log (via the API) if there is more than 1 MB of logs in the rotation period.
Downloading a busy log directly from Amazon RDS requires that partial downloads are managed. It’s necessary to synchronize the activity of downloading the log file partials with the log_rotation_age, log_rotation_size, or log_filename in order to know the log file that the partial download is operating on. That is not trivial, is unlikely to add significant business value, and runs counter to our tenet to minimize custom code.
Finally, sending the database logs to CloudWatch Logs also works for Amazon Aurora Serverless. This makes it possible to provide a common approach to manage your database logs across all of your PostgreSQL databases on AWS.
Host a Docker image for pgBadger in Amazon ECR
The fundamental functional requirement is to run pgBadger over the database logs. pgBadger requires a modern Perl distribution. It’s possible to run Perl as a Lambda custom runtime. We didn’t choose this approach because it wasn’t necessary to actually write the Lambda functions in Perl but rather just to invoke Perl and pgBadger. It’s also possible to have a Perl distribution as a Lambda layer. We didn’t choose this approach because with so many constituent parts (Perl distribution, pgBadger, supported AWS runtime and AWS SDK calls), it was preferable to consolidate in a single deployable artifact.
Using a container means we write our function in a language that Lambda has core support for. We can also package together all the dependencies, including the runtime and specific version of pgBadger. Finally, we can improve our security posture using the vulnerability scanning built into Amazon ECR.
We provide a Docker file based on the Lambda Python runtime. The following code shows some key sections:
The recipe that we used started with the base Lambda runtime image and used yum to add the core dependencies and wget to add pgBadger. We chose this approach for the sake of simplicity. For production deployments, you should consider any requirement to use different yum repositories and not the Amazon ones. For more information, refer to Add repositories on an Amazon Linux instance. Also, consider a multi-stage image build so the utilities used to build the container aren’t present in the final image, for example: wget.
For instructions to set up a Lambda function with a container image stored in Amazon ECR, refer to Creating Lambda container images.
Walkthrough overview
In this section, we walk through the key components in the solution and explain the decisions we made in arriving at this architecture.
The solution features the following key stages:
- Move data from CloudWatch Logs to Amazon S3 with Kinesis Data Firehose.
- Raise an Amazon S3 event notification with publication to an Amazon SQS queue.
- Trigger the Lambda function that has the Amazon SQS queue as the event source and runs pgBadger.
- Configure private networking.
- Persist results between Lambda invocations with a mounted Amazon EFS file system.
- Move data from Amazon EFS to Amazon S3 with DataSync tasks.
- Secure access to the results with an S3 bucket policy.
The entire solution can be found in the GitHub repo along with detailed deployment steps. At a minimum, the following two AWS CloudFormation templates need to be deployed: vpc-3az.yml and pgbadger.yml. Total deployment time for both stacks is under 10 minutes.
Once you have fulfilled the pre-requisites and completed the deployment then your database logs will start flowing through the system without you having to do anything else. The first report will be available within an hour. The report url is available in the PGbadgerWebsiteURL output parameter of the pgbadger.yml CloudFormation Stack, as in the screenshot below.

With that url you can make a browser request from an instance inside the Amazon VPC just created and you will see the reports interface for pgBadger, as in the screenshot below.

Move data from CloudWatch Logs to Amazon S3 with Kinesis Data Firehose
As the log events are consolidated in a single log stream in CloudWatch Logs, it’s then necessary to move them to a staging location. We chose Amazon S3 as the staging location.

It’s possible to export the log stream out of CloudWatch Logs and into Amazon S3 using the AWS Command Line Interface (AWS CLI) create-export-task command. We chose not to do this for two reasons. First, it’s limited to a time-bound export. On a busy database, a time-bound export can have significantly more log entries than on a quieter database. This makes it difficult to size the Lambda environment effectively for pgBadger to run. The second reason is that the CloudWatch export task API only allows a single export task to run concurrently in an account. Assuming nothing about the other processes that are running in the account, it’s unsafe to design a system that consumes the entirety of an account limit.
We chose Kinesis Data Firehose to move the logs to the staging location. BufferingHints allows a buffer size and a buffer time to be specified, and the stream is written on the first of those two events to trigger. The outcome of this is a maximum object size, and this information can be used to tune the downstream compute. Also, Kinesis Data Firehose has a soft limit of 50 delivery streams per account per Region, so it’s safer to assume there is the limit capacity in the account to include the delivery stream.
CloudWatch Logs formats the log events as JSON. pgBadger doesn’t recognize the log in the CloudWatch Logs format. Therefore, it must be transformed back to its native format first. This adds cost to the solution because for each delivery stream buffer, a Lambda function has to run to perform the decompression, transformation, and recompression, and put the records back in to the stream. It also runs counter to the tenet to minimize custom code. However, this latter counterpoint is mitigated by the fact that there are blueprints available for this transformation, and we provide an example in this solution. Furthermore, this doesn’t need to change after it’s implemented unless the CloudWatch Logs log format changes. That the transformation is required at all is a cost to bear so that log chunks will be limited to a maximum size and predictable performance of the pgBadger Lambda function is possible.
For instructions to set up the Kinesis Data Firehose integration with CloudWatch Logs, refer to Using CloudWatch Logs subscription filters. Note that in our solution we don’t apply a FilterPattern to the SubscriptionFilter, as shown in the following code. This is because we want to analyze log entries for all databases in the cluster. Downstream, pgBadger can split the reporting per database or consolidate it at the cluster level. If, however, you prefer to target a specific database, you can enter the database name in the FilterPattern to only push log entries for that database into Kinesis Data Firehose. The database name (%d) is in the supported log_line_prefix for Amazon RDS, which is why the FilterPattern works on every log statement.
Raise an Amazon S3 event notification with publication to an SQS queue
We can send Amazon S3 event notifications to Amazon Simple Notification Service (Amazon SNS), an SQS standard queue, Lambda, or Amazon EventBridge. We chose an SQS queue in this instance in order to create a seam between the producer side of the system (Amazon RDS, CloudWatch Logs, Kinesis Data Firehose, and Amazon S3) and the consumer side of the system (Lambda and Amazon EFS).

Amazon S3 event notifications have at-least-once delivery semantics and although typically delivered in seconds, can sometimes take a minute or longer. These characteristics introduce challenges around message ordering and idempotence to the solution.
Considering order first, when running in incremental mode, pgBadger uses a bookmark implemented with a file called LAST_PARSED. This file contains the last timestamp that was read and the offset it was read at. Normally, in the presence of the LAST_PARSED file, pgBadger opens a log and seeks to the offset. If the new file is shorter than the offset, then pgBadger resets the offset to 0 and matches the timestamp. If the timestamp of the entry at the offset is earlier than the timestamp in the bookmark, it skips the file. This mechanism means that if log chunks are processed out of order, then there is a possibility they will be skipped and their analysis missed from the results.
In anticipation of log chunks being processed out of order, this solution removes the bookmark after a log chunk has been processed. However, now that the bookmark isn’t present, another mechanism is required to make sure a file isn’t processed twice. If the file is processed twice, the query counts will not be an accurate reflection of the database activity. The way that is done is by removing the log chunk from Amazon S3 after it has been processed. Therefore, if a second notification is delivered for the same event, on attempting to process that event, the code will not find the log chunk object in Amazon S3, error, and ultimately drop the message in the dead-letter queue.
Trigger the Lambda function that has the Amazon SQS queue as the event source and runs pgBadger
We now look at the Lambda function on the consumer side, which has the Amazon SQS queue as the event source.

After the messages are buffered in the queue, it’s possible to configure the retrieval by setting the batch size or batch window. Invoking Lambda with a batch of Amazon SQS messages can help reduce compute costs. However, we have designed this solution so that pgBadger can only have a single concurrent run. This serialization is enforced with a Lambda SQS batch size of 1 (the default is 10 for standard queues) and a Lambda reserved concurrency of 1.
An alternative to this approach is to increase the batch size and perform more work in each Lambda invocation. pgBadger can analyze multiple log files in the same run. It’s also possible to allocate more than one core to pgBadger to process files in parallel. We didn’t choose this because it would require more custom code to interpret and respond to a file processing failure. However, this remains a viable option for tuning system performance and cost after the database log activity is better understood.
Configure private networking
All the services in this solution support VPC endpoints. VPC endpoints are powered by AWS PrivateLink. That means the traffic can be confined to the AWS backbone network and not transit the internet. Due to the fact that Lambda needs to access Amazon EFS, it must be attached to a VPC. The attachment lands one ENI per subnet per security group in the VPC. Amazon EFS is accessible via a mount target, up to one per Availability Zone in a single VPC. We chose an Amazon S3 Gateway interface so that the Amazon S3 traffic can transit over the private networking too. Finally, DataSync uses up to two ENIs per Availability Zone.
One of the design requirements of our solution was to assume nothing about the database, which means it’s not safe for these ENIs to consume IP addresses in the database VPC. Therefore, we use a separate VPC. This distinct VPC (called pgBadger VPC in the diagrams), can be as small as a /26 for a three-Availability Zone deployment of the solution, and there is no requirement for two-way external routing (so IPv4 CIDR space can safely be reused for this VPC). The following diagram shows the private networking in the consumer side of the architecture.

Diving deeper in to the interaction between Lambda, Amazon EFS, and Amazon S3, there are a number of AWS network features, such as security groups, route tables, and endpoint policies, that allow traffic to be further restricted. These are illustrated in the following diagram.

Any ENI in a VPC has a security group, and that applies to the Amazon EFS mount target and the Lambda ENI as well. The Lambda security group has no inbound security group rules because connections initiated outside of Lambda can’t call in to the service, so the Lambda rules are outbound only to Amazon EFS and Amazon S3. The Amazon EFS mount target security group accepts incoming connections from Lambda, and there are self-referencing inbound and outbound rules to fulfill the DataSync requirements, as shown in the following diagram.

The route table associated to the subnet only allows access to Amazon S3 via the associated endpoint. The Amazon S3 Gateway endpoint policy only allows the Lambda function to get and delete objects from the bucket where Kinesis Data Firehose has stored the log chunks. After pgBadger has operated over the log chunk, it’s deleted.
Because the networking is configured in a separate CloudFormation template, the S3 bucket ARN isn’t available to the Amazon S3 Gateway endpoint policy at the time of execution. When you use this solution, you have to manually restrict the Amazon S3 Gateway endpoint policy to your bucket resource.
Persist results between Lambda invocations with an attached Amazon EFS file system
We now move to the next step on the consumer side.

pgBadger needs a location to read the log file from and write the reports to. pgBadger can read remote logs files directly from an S3 bucket, but currently only supports public buckets over an unencrypted HTTP connection. This goes against the tenet to prefer private networking and the requirement for a secure solution. Storing a database log file in a public location is a significant security risk and should never be done.
The log chunks are stored in Amazon S3 and the location notified to Lambda via the Amazon S3 event notification and Amazon SQS. The function copies that data to the Lambda local storage, which becomes effectively the working directory for the application. The minimum storage of 512 MB is suitable for this purpose. If you intend to tune the system to either process larger log chunks or multiple log chunks, bear in mind that this storage scales in 1 MB increments up to 10,240 MB. The results are stored on Amazon EFS, which is mounted to Lambda.
Move data from Amazon EFS to Amazon S3 with DataSync tasks
Guided by our tenets to reduce custom code and prefer managed services, we use DataSync to move the pgBadger results from Amazon EFS to Amazon S3 on a schedule.

However, this service selection has some shortcomings for our use case.
DataSync tasks are limited to a minimum frequency of 1 hour. The solution only uses a single subnet to access the Amazon EFS location, therefore it can be extended to have a task run from each of the two remaining subnets. Staggering the schedules will mean that Amazon S3 can be updated every 20 minutes, at best.
The rest of the architecture is event driven, where the class of event is data availability. In choosing to use DataSync on a schedule, we have introduced a different event class, namely, time. Different event classes act on the architecture differently. It’s possible we could see writes happening to files on Amazon EFS as they are synchronized with the Amazon S3 location, potentially causing transfer verification to fail. This wasn’t observed in testing, and we prefer to wait and see if the problem emerges before changing the architecture. To observe this, we have specified a verification of transferred files and logging of each file transferred to CloudWatch Logs, as shown in the following code:
These settings produce output in CloudWatch Logs, as shown in the following screenshot, where the transfer of the file and verification on the checksum is reported.

In the event that this service selection doesn’t stand the test of time, there are numerous options to refactor, including the DataSync API.
Secure access to the results with an S3 bucket policy
Finally, reports are delivered to an S3 bucket protected by an S3 bucket policy.

pgBadger produces a report, which is a self-contained bundle of static HTML, JavaScript, and CSS. One secure and scalable mechanism to serve static websites is to use Amazon S3 website hosting. We decided to use this method and to limit access to only requests coming from the Amazon S3 Gateway endpoint previously deployed in the pgBadger VPC. The resulting report viewed from a browser appears in the following screenshot.

For more information on how to use a condition on the S3 bucket policy to achieve the access limitation, refer to Controlling access from VPC endpoints with bucket policies.
Monitor system health
The health of this system is described by a number of metrics, which depend on the anticipated volume of logs generated by the database. In this section, we describe the log throughput capacity of the system and where it can be tuned to keep up with the log volume generated by the database.
Producer
In this section, we describe the theoretical maximum throughput of the producer aspect of the architecture, along with how to monitor it.
A CloudWatch Logs event size is limited to 256 KB. A CloudWatch Logs event equates to some number of entries in the PostgreSQL log. These entries are batched up to a maximum batch size of 1 MB. You can run five PutLogEvents requests per second per log stream. However, the number of log streams used to send the logs to the log group is an implementation detail of Amazon RDS and CloudWatch. Therefore, the maximum throughput between Amazon RDS and CloudWatch Logs would be an emergent system property, and for the majority of use cases this isn’t a practical limitation of the system.
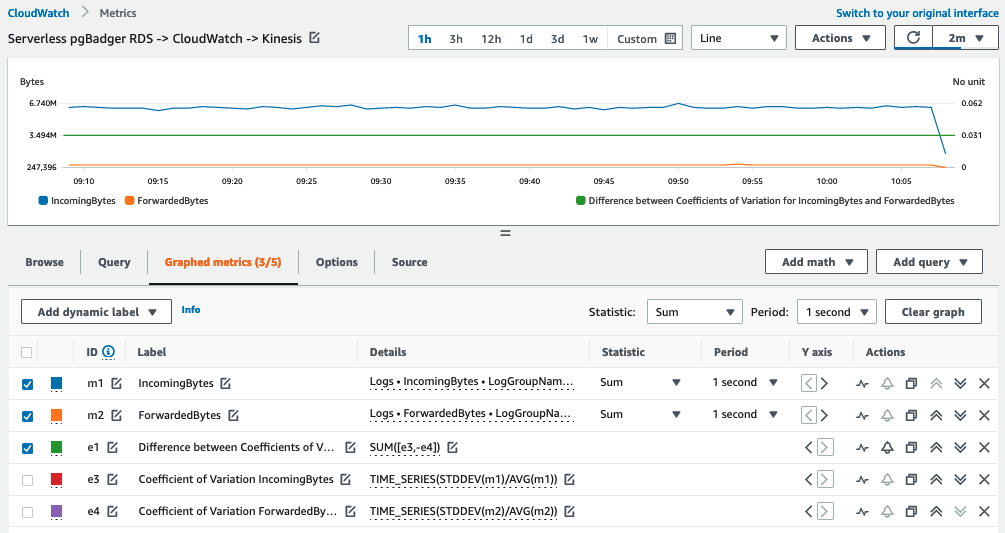
Nevertheless, it’s worth observing this in CloudWatch by monitoring IncomingBytes for the database log stream. It’s also informative to observe ForwardedBytes, which when charted should have the same shape but be an order of magnitude smaller to account for the compression CloudWatch performs before forwarding the data to Kinesis Data Firehose. You can use the coefficient of variation (calculated as the standard deviation divided by the mean), to remove the effect of the scale of each distribution, and use CloudWatch metric math to display the difference between the two time series, which should remain at or very close to zero all the time. Any significant and sustained deviation from zero might indicate a problem forwarding log entries to the delivery stream. This is shown in the following screenshot; note the very small units on the right Y-axis for the difference between the coefficients of variation.
The solution uses Direct PUT from CloudWatch Logs to Kinesis Data Firehose. CloudWatch collects log events in an array with a maximum compressed size (before base64 encoding) of 1000 KiB. It then uses the PutRecordsBatch and PutRecords API methods to move the records to the delivery stream. Considering the case of deployment to the eu-west-1 Region, that means the relevant limit is 5 MiB BytesPerSecondLimit, and this is plotted against the IncomingBytes for the delivery stream, as shown in the following screenshot. At this point, both metrics refer to the volume of compressed data. This is the first throughput-limiting threshold in the system, and it’s worth alarming on this. In the event that it’s necessary to ingest more than 5 MiB of data, the system can be redesigned to take advantage of dynamic partitioning of the stream.

Inside the delivery stream, there is a Lambda function that transforms the data back from the CloudWatch Logs format to the Amazon RDS log format, recompresses it, and returns it to the delivery stream. How much data to buffer before invoking the Lambda function to perform the transformation is informed by ProcessingConfiguration, as shown in the following code:
Every time a buffer is filled, Kinesis Data Firehose invokes Lambda in synchronous invocation mode with that batch of data. Kinesis Data Firehose scales the concurrent Lambda invocations automatically. This makes it unlikely that the transformation will be a limiting factor in the throughput of this architecture. However, increasing throughput at this point is a function of tuning ProcessorConfiguration and making the transformation code more efficient. We provide a Python implementation as a starting point.
Monitoring system health at this point (absent telemetry you implement if you decide to change the transformer function) is as simple as observing errors reported by the Lambda function. To have richer insights, you can set up Amazon S3 request metrics filters on the failure and success prefixes, and observe the number of bytes that are put there.
These CloudWatch metrics are billed at the same rate as CloudWatch custom metrics. Both prefixes contain compressed and encoded data, but they have undergone different transformations. Therefore, it isn’t meaningful to use them raw, in ratios with IncomingBytes or ForwardedBytes. These metrics appear in the following screenshot.

Presuming no errors have occurred, the transformed, encoded, and compressed logs in Amazon S3 represent 100% of the logs emitted by the database. The theoretical maximum throughput of the producer aspect of the architecture is 5 MiB per second of compressed logs (gzip level 6).
If there are errors in the Lambda transformer function and data ends up in Amazon S3 in the error prefix, the messages are compressed JSON, with the payload that encountered the error in the rawData attribute. The payload will be compressed again and when decompressed, it will be in CloudWatch Logs format. The data is now equivalent in volume terms to IncomingBytes, should you need to construct a ratio of ErrorBytes and IncomingBytes.
Consumer
In this section, we discuss the theoretical maximum throughput of the consumer side of the architecture along with how to monitor it.
An Amazon SQS standard queue connects the producer and consumer sides of the architecture. An Amazon SQS standard queue can contain an unlimited number of messages. Therefore, system throughput isn’t limited by the queue.
For every object laid down in the success prefix in Amazon S3, an event is placed on the queue. If an Amazon S3 request metric filter on the success prefix has been set up, then the number of PUT requests should broadly equate to the number of Amazon SQS messages received. If the processing has been successful, these numbers should broadly equate to the number of objects deleted from the success prefix (as mentioned earlier, the function removes the log chunk after processing to ensure idempotence). Finally, each of these metrics should broadly equate to the number of Lambda function invocations for the pgBadger executor function. Each of these metrics, however, can reflect retries and certain failures, so their divergence from each other should not be over-interpreted.
The solution uses another SQS standard queue as a dead-letter queue (DLQ). After three failed attempts to process a message, it drops into the DLQ. A message in the DLQ means there will be a log chunk in Amazon S3 that needs to be reprocessed. The solution doesn’t have a retry policy, and it’s necessary to investigate the failure in the Lambda logs before discarding the log chunk or attempting to reprocess it manually.
Presuming no errors, the maximum throughput of the consumer side of the architecture is limited by the time it takes the Lambda function running pgBadger to complete. For example, if 1 log chunk of 0.5 MB in size is processed in a single Lambda function invocation and that invocation takes 30 seconds, then the maximum throughput is (2*0.5MB)/60 seconds = 17,476 Bytes/second. The following figure shows this number by calculating the average BytesUploaded in the success prefix divided by the average number of Lambda invocations in a 5-minute period. In practice, this will be an emergent system property and likely the limiting factor of the entire solution.

Presenter
The presenter aspect of the architecture has no effect on the throughput of logs through the system. This is because it only presents the results of the analysis, which is entirely captured by the output of pgBadger. There are limitations of only using a single task; for more information about the system quotas, refer to AWS DataSync quotas. However, they don’t affect throughput and, given the compact nature of the results of pgBadger, are unlikely to apply at all.
From an operational point of view, given that file verification has been enabled, it’s sufficient to observe the final status of the task and whether it’s Success or Error.
Costs
Costs are considered through the lens of log throughput. A number of scenarios were generated using AWS Cloud9 running pgbench. AWS Cost Explorer was enabled to analyze the costs. The following table shows the daily running costs for the solution for different log volumes.
| Log Volume | Total Daily Cost | Top 1 Service | Top 2 Service | Top 3 Service |
| 0.5 GB | $0.32 | Amazon CloudWatch Logs: $0.25 | AWS KMS: $0.03 | Amazon S3: $0.03 |
| 5.2 GB | $2.48 | Amazon CloudWatch Logs: $2.42 | AWS KMS: $0.03 | Amazon S3: $0.02 |
| 10.3 GB | $4.91 | Amazon CloudWatch Logs: $4.82 | AWS KMS: $0.03 | Amazon S3: $0.03 |
| 15.5 GB | $7.31 | Amazon CloudWatch Logs: $7.22 | AWS KMS: $0.03 | Amazon S3: $0.03 |
| 23.2 GB | $10.94 | Amazon CloudWatch Logs: $10.84 | Amazon Kinesis Data Firehose: $0.04 | AWS KMS: $0.03 |
The largest influence on overall cost is the ingestion of logs into CloudWatch Logs. The second and third highest contributing services are stable as AWS Key Management Service (AWS KMS) and Amazon S3 up until 23.2 GB of logs are generated. At that point, Kinesis Data Firehose becomes more costly than AWS KMS.
Log storage also contributes to the CloudWatch Logs cost. In our case, we have set retention at only five days for the purpose of generating the cost reports and reconciling with the log volumes. Given that sending the PostgreSQL logs to CloudWatch Logs is a prerequisite for this solution, and you may have different retention settings, you may not see exactly the same costs as shown in this post when you implement the solution.
Clean up
To avoid incurring future charges to your AWS account, you can delete the resources created in this solution. Because the solution was deployed by running an CloudFormation template, you can delete the stack by following these steps on the AWS CloudFormation console:
- On the AWS CloudFormation console, select the stack you created.
- On the Actions menu, choose Delete Stack.
- When prompted to confirm, choose Yes, Delete.
- Wait for
DELETE_COMPLETEto appear in the Status column for the stack.
Conclusion
In this post, we showed a solution design that enables the analysis of PostgreSQL database logs using no persistent compute resources. This allows a DevOps professional to use the popular open-source log analyzer pgBadger without having to concern themselves with provisioning, securing, and maintaining additional compute and storage resources. We also showed the limitations of the system, how to observe them with CloudWatch, and where you can tune the solution to match your database log throughput. Finally, we discussed in detail how we selected services for this solution and alternatives to the choices we made. This same solution framework can be reused to run different processes over the database logs by changing the Lambda container image.
We encourage you to try out the solution and post any feedback in the comments below or raise an issue in the GitHub repo.
About the Authors
 Chirag Dave is a Senior Database Specialist Solutions Architect with Amazon Web Services, focusing on managed PostgreSQL. He maintains technical relationships with customers, making recommendations on security, cost, performance, reliability, operational efficiency, and best practice architectures.
 Krishna Sarabu is a Senior Database Specialist Solutions Architect with Amazon Web Services. He works with the Amazon RDS team, focusing on open-source database engines Amazon RDS for PostgreSQL and Amazon Aurora PostgreSQL. He has over 20 years of experience in managing commercial and open-source database solutions in the financial industry. He enjoys working with customers to help design, deploy, and optimize relational database workloads on AWS.
 Mark Townsend is a Solutions Architect with Amazon Web Services, working in the Global Financial Services practice in London. Mark is especially interested in decision-making in the systems design process. Prior to joining AWS, Mark spent his career in technology and operations roles in financial services firms in London.