Source Code: https://github.com/supabase/pg_netstat
pg_netstat monitors your PostgreSQL database network traffic.
This extension runs a background worker to capture network packets on the Postgres port, and provides realtime network stats data by a view pg_netstat. It uses libpcap to capture packets and aggregates at user-specified interval.
The pg_netstat view can contain at most 60 history rows and discards the oldest rows when it is full, so choose your interval wisely.
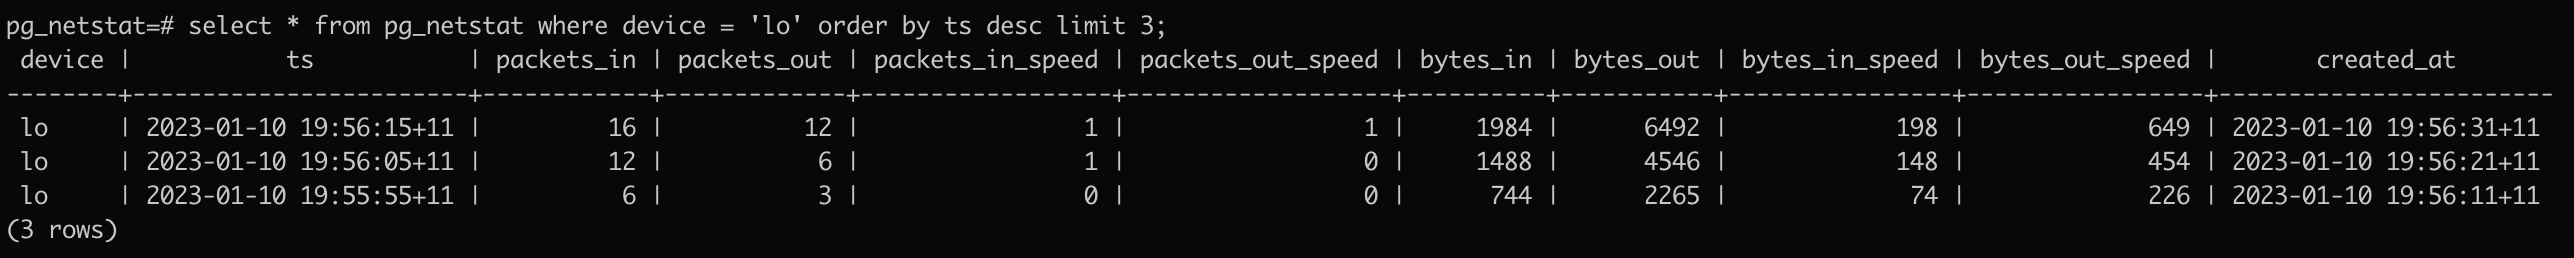
You can query realtime network stats through the pg_netstat view.
select * from pg_netstat;Query result is like below:
Prerequisites
-
Before install this extension, you need to give network packet capture permission to Postgres binary. For example,
sudo setcap cap_net_raw,cap_net_admin=eip /usr/local/pgsql/bin/postgres -
libpcaplibrary should be installed too, for example,sudo apt-get install libpcap-dev
After that, we can then start the installation. Download this repo and set up pgx:
cargo install cargo-pgx
After pgx is set up, use below command to build the extension package:
cargo pgx package --pg-config ~/.pgx/14.5/pgx-install/bin/pg_config
The extension is located at path ./target/release/pg_netstat-pg14. For more information, please visit pgx site.
Change postgresql.conf to enable below line:
shared_preload_libraries = 'pg_netstat' # (change requires restart)
Restart the server and install extension in database:
create extension pg_netstat;

-- check everything is working
select * from pg_netstat;Below are the configurations you can put in postgresql.conf file:
pg_netstat.devices- Network device names to capture packets from, delimited by comma, maximum 4 devices, default is auto detectpg_netstat.interval- How often network packets to be collected (in seconds), default is10pg_netstat.capture_loopback- Whether capture packets on loopback device, default isfalsepg_netstat.packet_wait_time- How long to wait for network packets to be deliverd to collector (in seconds), default is5pg_netstat.pcap_buffer_size- pcap setting for buffer size (in bytes), default is1000000pg_netstat.pcap_snaplen- pcap setting for snapshot length (in bytes), default is96pg_netstat.pcap_timeout- pcap setting for packet buffer timeout (in milliseconds), default is1000
You can list network device name by running ifconfig command. For example, device name for 'localhost' is lo. The device auto detect will use the first device that is not a loopback network interface.
The most useful config is pg_netstat.interval, which defines the stats collection frequency. Its change can be reloaded from config file by using pg_ctl command:
pg_ctl reload -D /path/to/pg-data
All the others settings are at low level and you probably don't want to change them. For all the pcap_* settings, see details at https://www.tcpdump.org/manpages/pcap.3pcap.html.
- Windows is not supported, that limitation inherits from
pgx. - Currently only supports PostgreSQL v14 and v15, if you need other versions supported please raise an issue.
- Replication haven't tested yet, use at your own risk.
All contributions, feature requests, bug report or ideas are welcomed.