
When doing query optimization work, it is natural to focus on timing data. If we want to speed up a query, we need to understand which parts are slow.
But timings have a few weaknesses:
They vary from run to run
They are dependent on the cache
Timings alone can hide efficiency issues — e.g. through parallelism
Don’t get me wrong, I still think timings are very important for query tuning, but in this article we’re going to explore how you can complement them with the amount of data read and/or written by a query, by using BUFFERS.
When people share stories of 1000x query speed-ups, they are usually a result of reading far less data overall (usually as a result of adding an index). In the world of performance, much like in the world of design, less is more.
To see the amount of data read/written by a query you can use the buffers parameter, for example by prefixing your query with:
explain (analyze, buffers)
There is a growing movement to turn buffers on by default, which I’d personally love to see. If anyone reading is able to review the patch to do so, I’d be very grateful!
One downside of including this extra data is that many folks already find Postgres explain output difficult to interpret. As such, I thought it’d be helpful to recap what exactly the buffers numbers mean, and describe some simple ways you can use them.
What do the buffer statistics mean?
We’ve written about the buffers statistics before, but the short version is that each of them consists of two parts, a prefix and a suffix.
There are three prefixes:
Shared blocks contain data from normal tables and indexes.
Temp blocks contain short-term data used to calculate hashes, sorts, materialize operations, and similar.
Local blocks contain data from temporary tables and indexes (yes, this is quite confusing, given that there is also a prefix “Temp”).
And there are four suffixes:
Hit means that the block was found in the Postgres buffer cache.
Read blocks were missed in the Postgres buffer cache and had to be read from disk or the operating system cache.
Dirtied blocks have been modified by the query.
Written blocks have been evicted from the cache.
These “blocks” are by default 8kB pages, and almost nobody changes this. If you want to check yours, you can do so by running:
show block_size;
Let’s take a look at a simple example query plan with buffers:
explain (analyze, buffers, costs off) select id, email from people where email = '45678@gmail.com';

Index Scan using people_email on people (actual time=1.066..1.071 rows=1 loops=1)
  Index Cond: (email = '45678@gmail.com'::text)
  Buffers: shared hit=3 read=1
Planning Time: 0.179 ms
Execution Time: 1.108 ms
From the line starting with “Buffers:” we can tell that, for this index scan, 3 blocks were read from the Postgres buffer cache (shared hit) and 1 block was read from the operating system cache or disk (shared read).
So when can the buffers be useful?
The buffers statistics can be useful in a number of ways, here are the most common that I see and hear about:
Spotting operations doing way more I/O than you expected
Getting a sense of the total I/O of the query
Spotting operations spilling to disk
Signs of cache performance problems
Let’s have a look at each of these cases.
1. Spotting operations doing way more I/O than you expected
If an index is returning a few thousand rows, you might be surprised to see it reading tens or even hundreds of thousand of blocks. Assuming our blocks are 8kB, reading 100,000 blocks is almost 1 GB of data!
Seeing that a 2-second scan read 5 GB of data definitely helps us understand why it was slow. Sure, without buffers you might have spotted that your index scan is filtering a lot of rows, but these are sometimes tricky to spot, since filter numbers are reported as a per-loop average.
In pgMustard, we try to do most of the arithmetic for people, and still focus more on the root cause of the issue (like index efficiency), but we also now calculate and more prominently display the total buffers on a per-operation basis.
Ryan Lambert included a nice example in his recent blog post on spatial indexing, where we can see an inefficient index scan reading about 39 GB to return 1m rows.
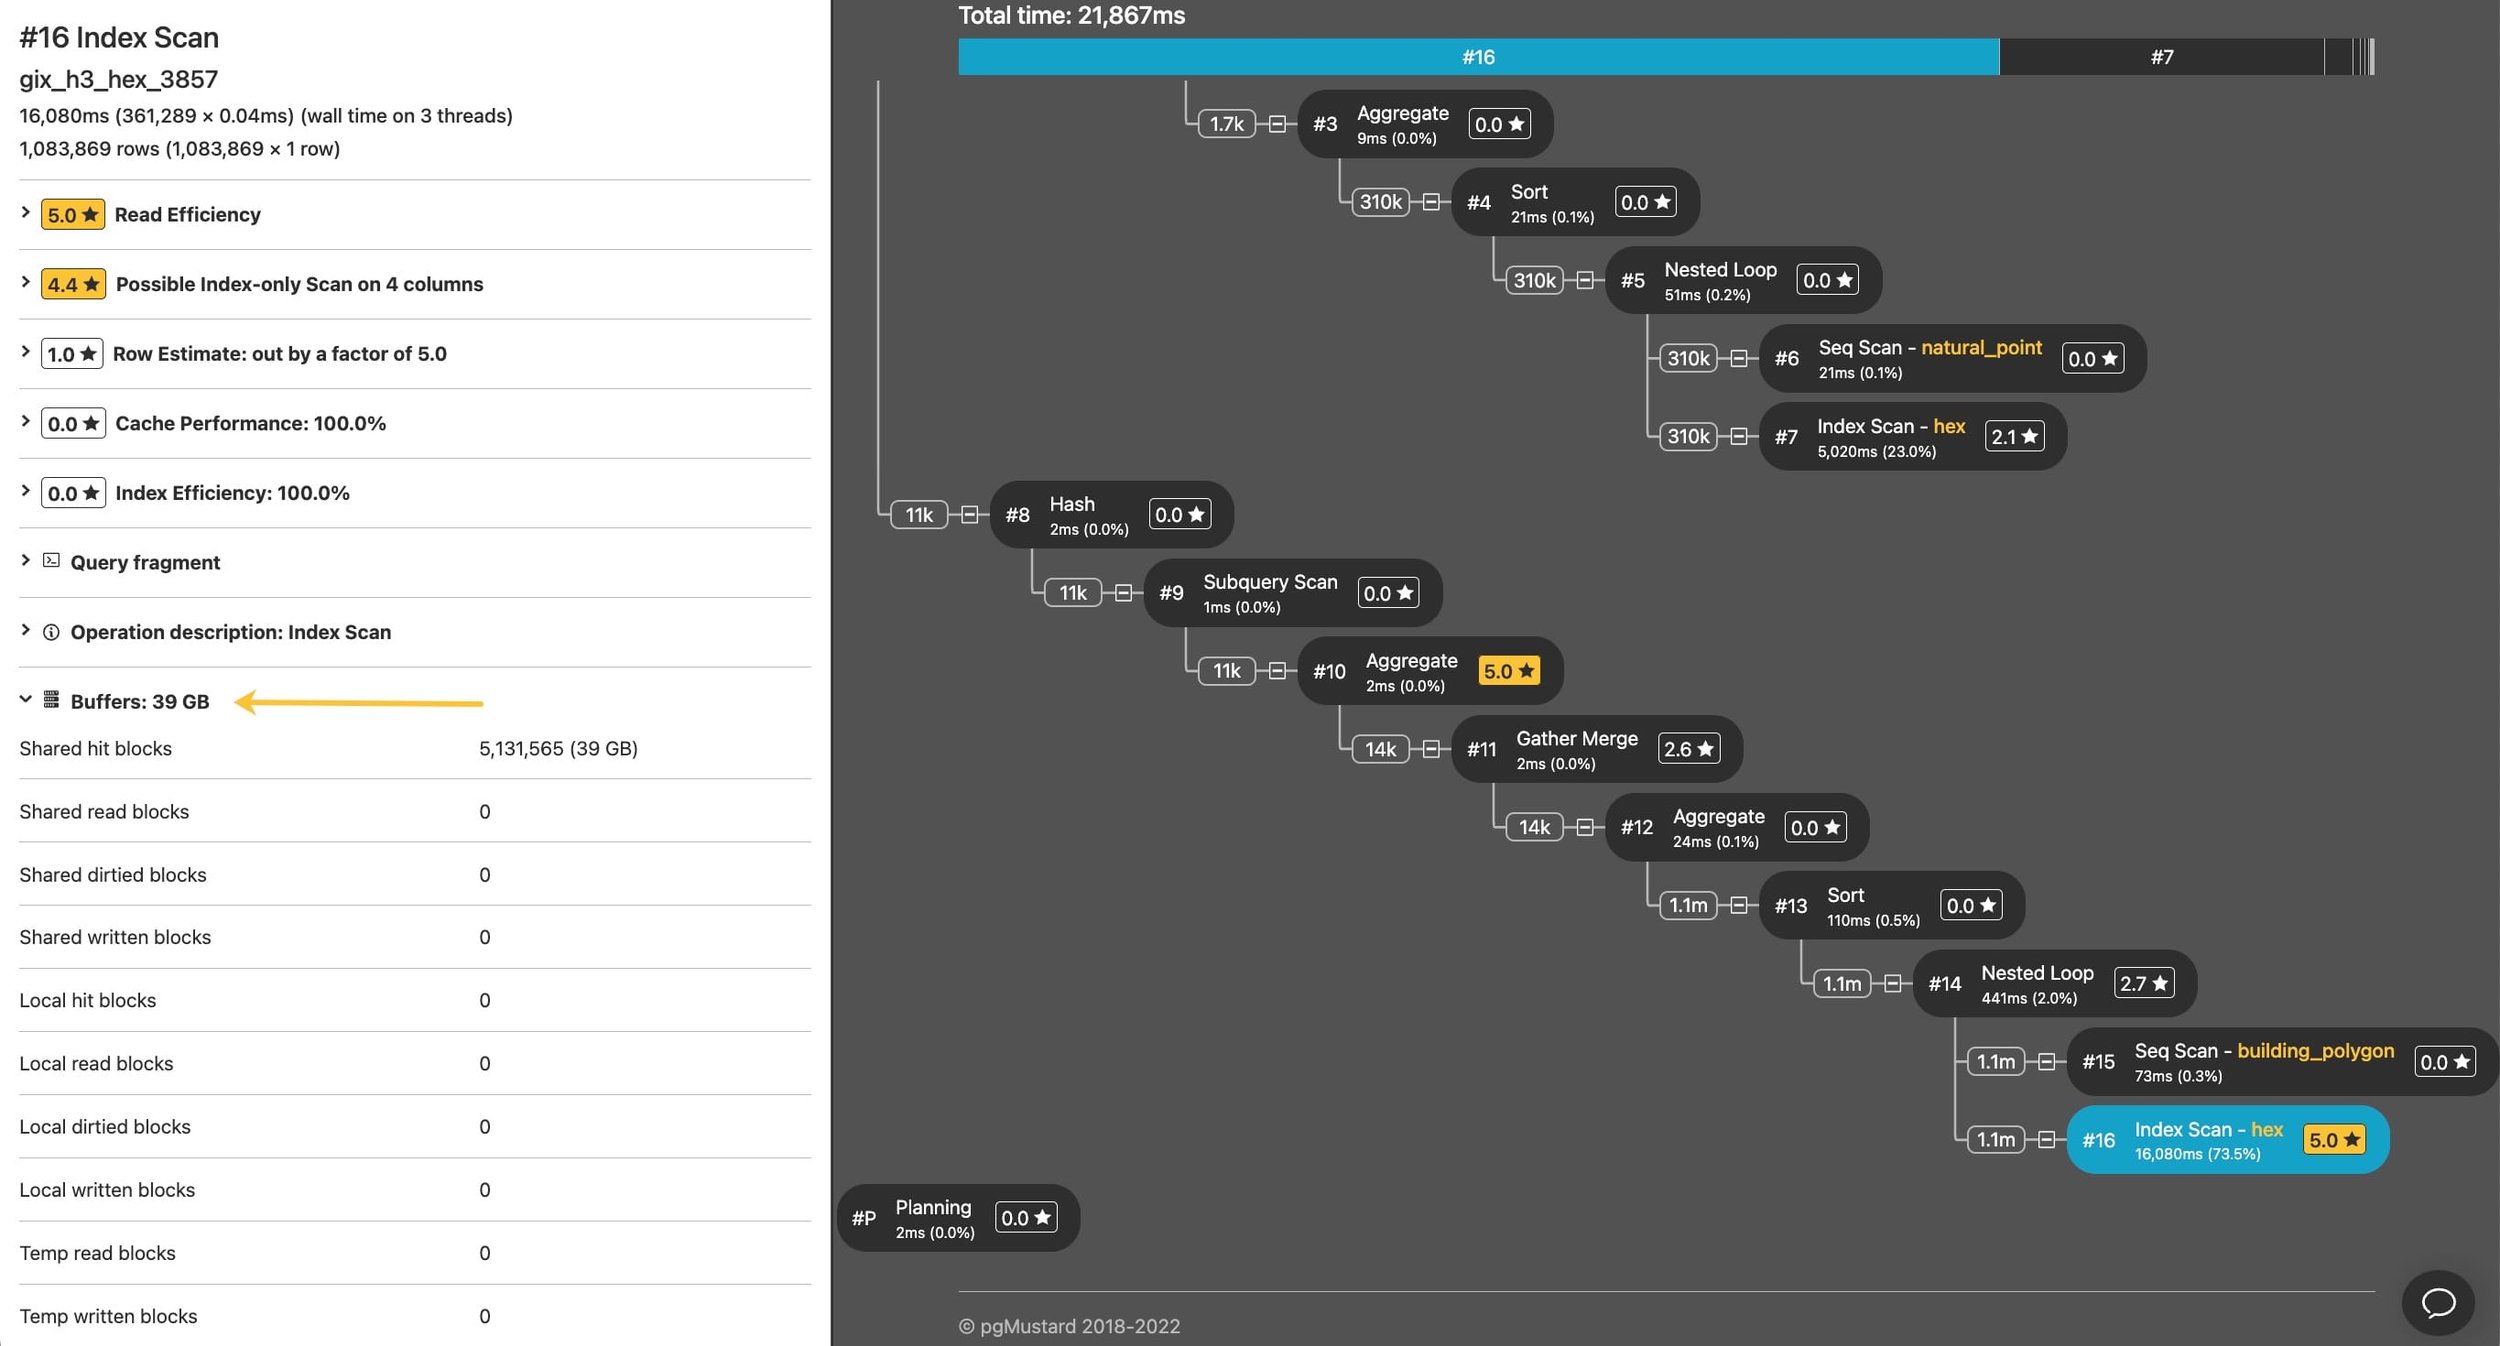
When viewing an operation in pgMustard, you can find its buffer stats in the pane on the left.
In the case above, Ryan was able to use a different indexing strategy to speed the query up by about 100x by (you guessed it) reading about 100x less data. 😄
2. Getting a sense of the total I/O of the query
Since parent operations include the buffers data of their children, you can usually get a quick sense of the total buffers by looking at the top node in a query plan.
We can see this by adding a limit to our simple example from earlier:
explain (analyze, buffers, costs off) select id, email from people where email = '45678@gmail.com' limit 1;

Limit (actual time=0.146..0.146 rows=1 loops=1)
  Buffers: shared hit=4
  ->  Index Scan using people_email on people (actual time=0.145..0.145 rows=1 loops=1)
        Index Cond: (email = '45678@gmail.com'::text)
        Buffers: shared hit=4
Planning Time: 0.230 ms
Execution Time: 0.305 ms
Note that the Limit node is reporting 4 blocks read (all from the Postgres cache). This is a total, inclusive of the index scan, which is of course responsible for all the reads. For more complex queries this can give you a quick sense check for total I/O.
In pgMustard, we sum the buffer statistics together and covert them to kB/MB/GB in a Summary section in the top left. The same blocks can be read more than once for the same query, and reads and writes to disk are also double counted, but since we see it as a very rough measure of “work done”, we think the sum works surprisingly well.

The same spatial query example from earlier, showing a sum of 51 GB buffers.
3. Spotting operations spilling to disk
Another common performance issue are operations spilling to disk.
Postgres does a nice job of telling us that a Sort has spilled to disk (via the Sort Method and Disk statistics) but for other types of operations, it can be trickier or impossible to spot without buffers.
Here’s a simple example of a Sort spilling to disk:
explain (analyze, buffers, costs off) select id, email from people order by email;

Sort (actual time=2501.340..3314.259 rows=1000000 loops=1)
  Sort Key: email
  Sort Method: external merge  Disk: 34144kB
  Buffers: shared hit=7255, temp read=4268 written=4274
  ->  Seq Scan on people (actual time=0.016..35.445 rows=1000000 loops=1)
        Buffers: shared hit=7255
Planning Time: 0.101 ms
Execution Time: 3335.237 ms
Since we asked for buffers, we can also see temp read/written numbers in the sort’s buffer statistics — which confirm that it wrote to (and read from) disk.
Looking out for temp buffers is a great way of spotting other types of operations spilling to disk that don’t provide as good reporting as sorts!
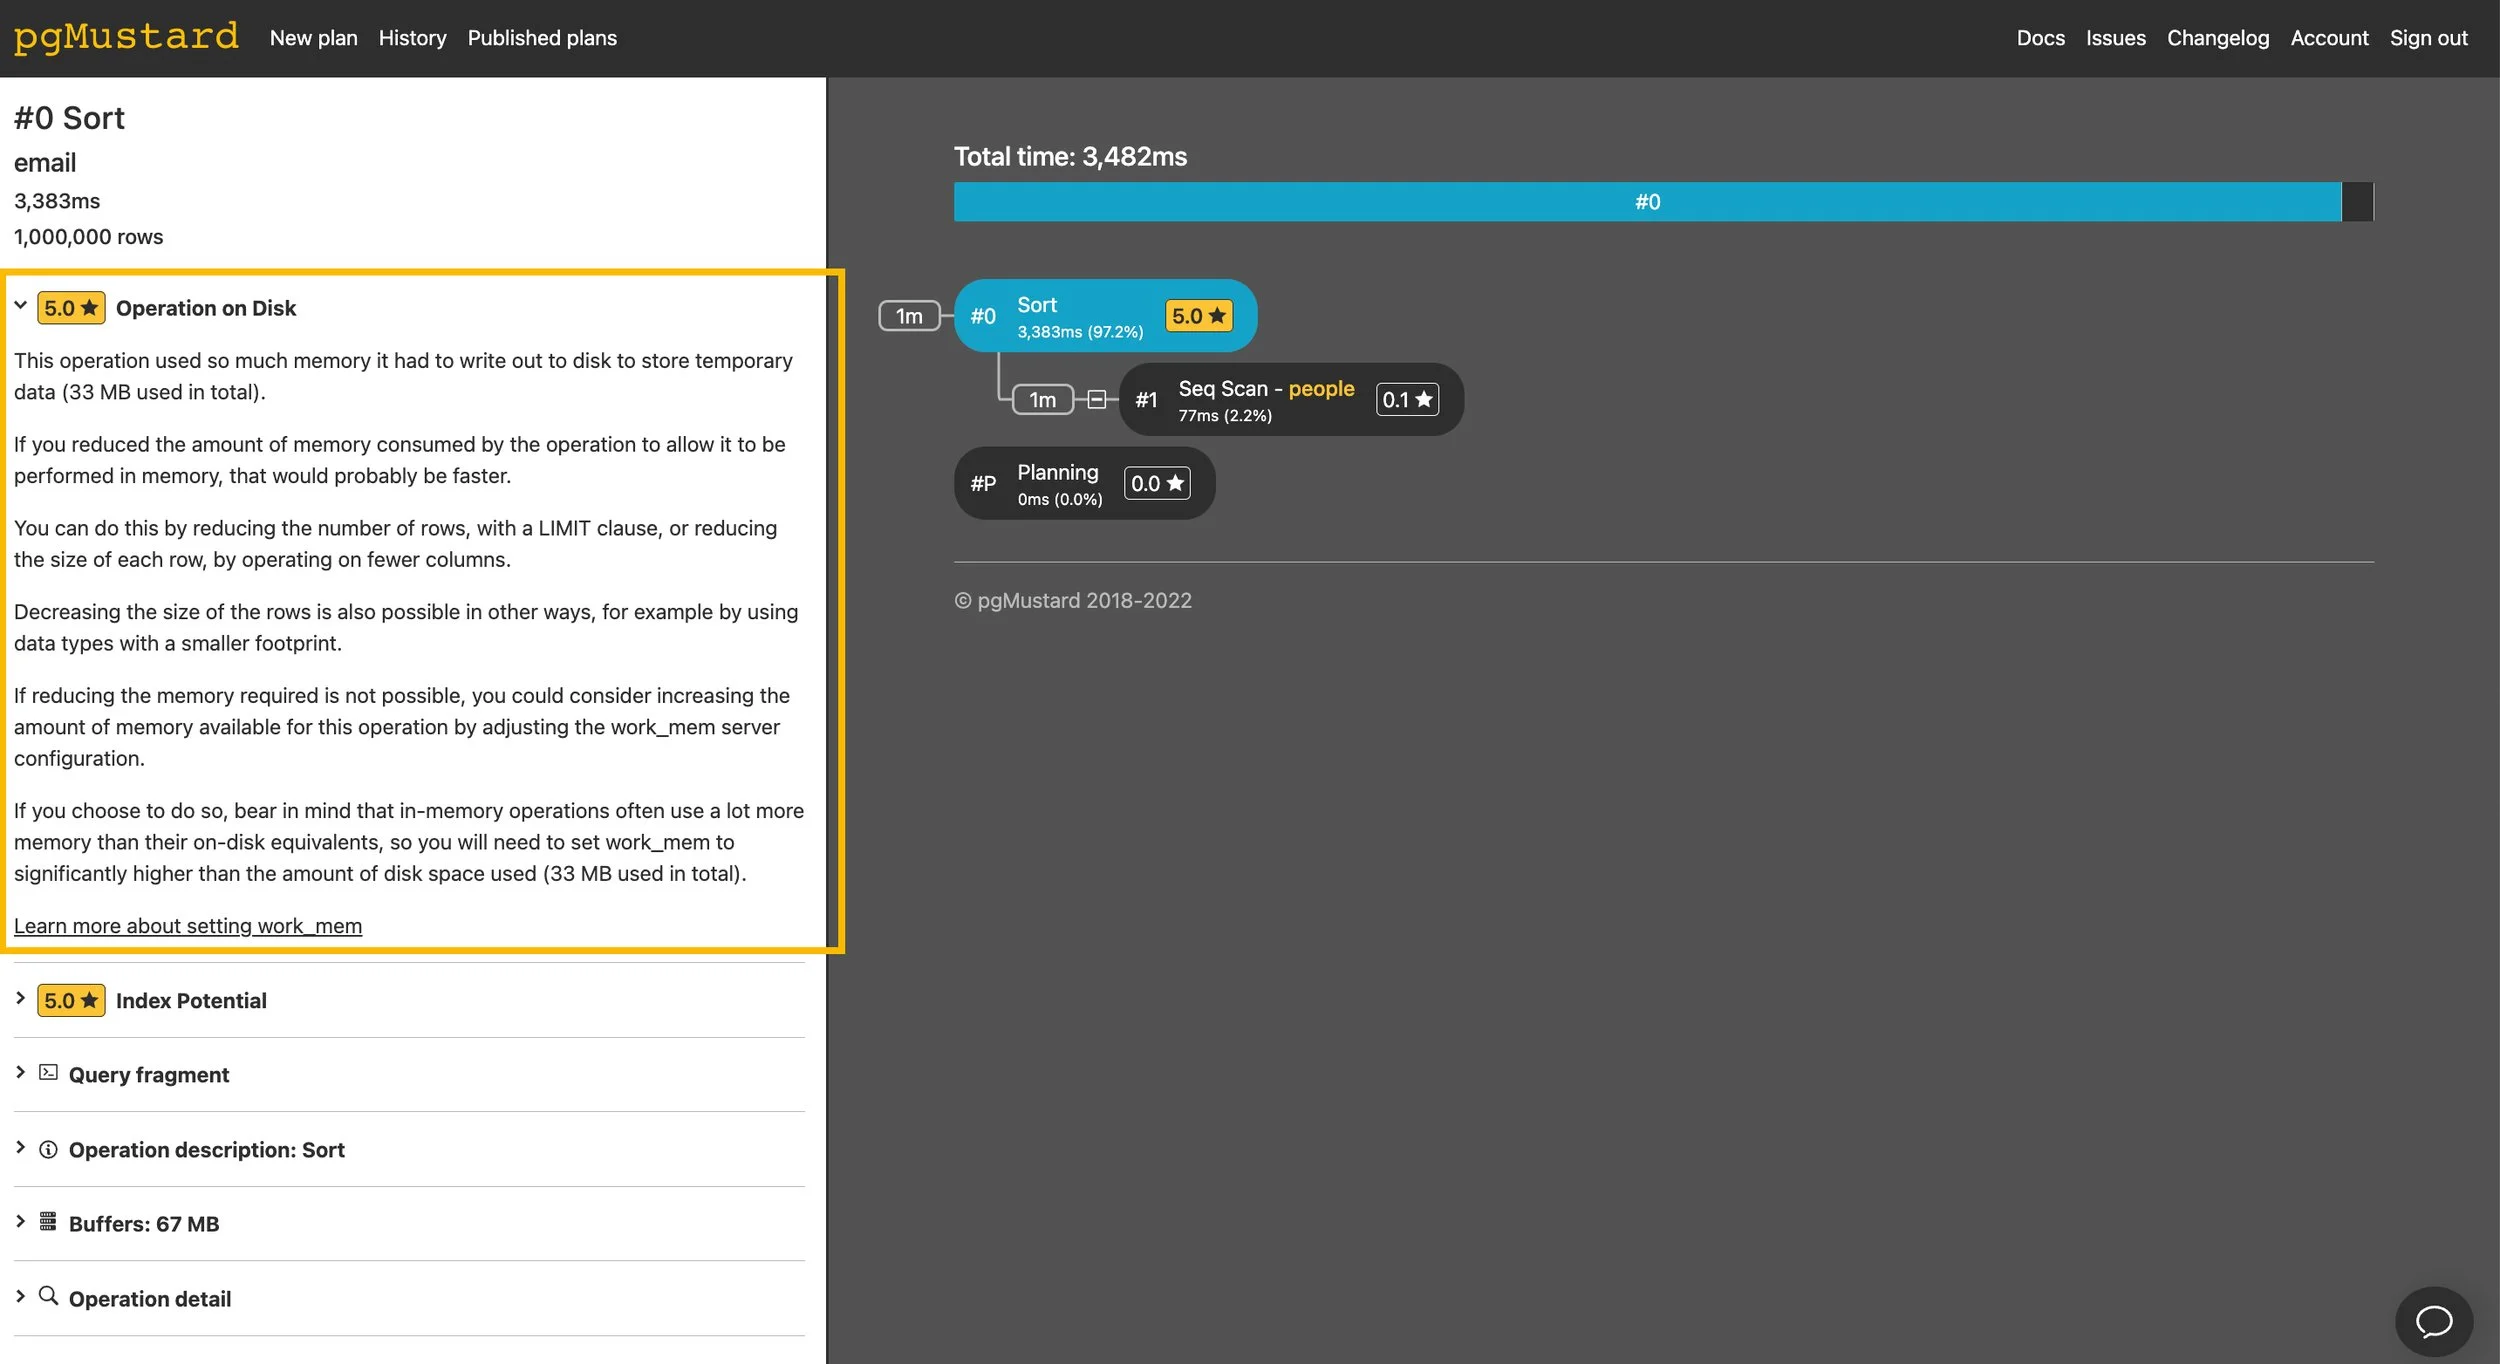
In pgMustard we report these as “Operation on Disk” tips. In this example, we should probably look into limiting the number of rows returned as a starting point 😇
4. Signs of cache performance problems
By comparing the number of shared hit and shared read blocks, we can get a sense of the cache hit rate. Sadly this isn’t perfect, as the latter includes operating system cache hits, but it is at least a clue during an investigation.
In the default text format of explain, it’s worth noting that you’ll only see non-zero buffers statistics. So, if you only see shared hits, then congratulations, all blocks were served from the Postgres buffer cache!
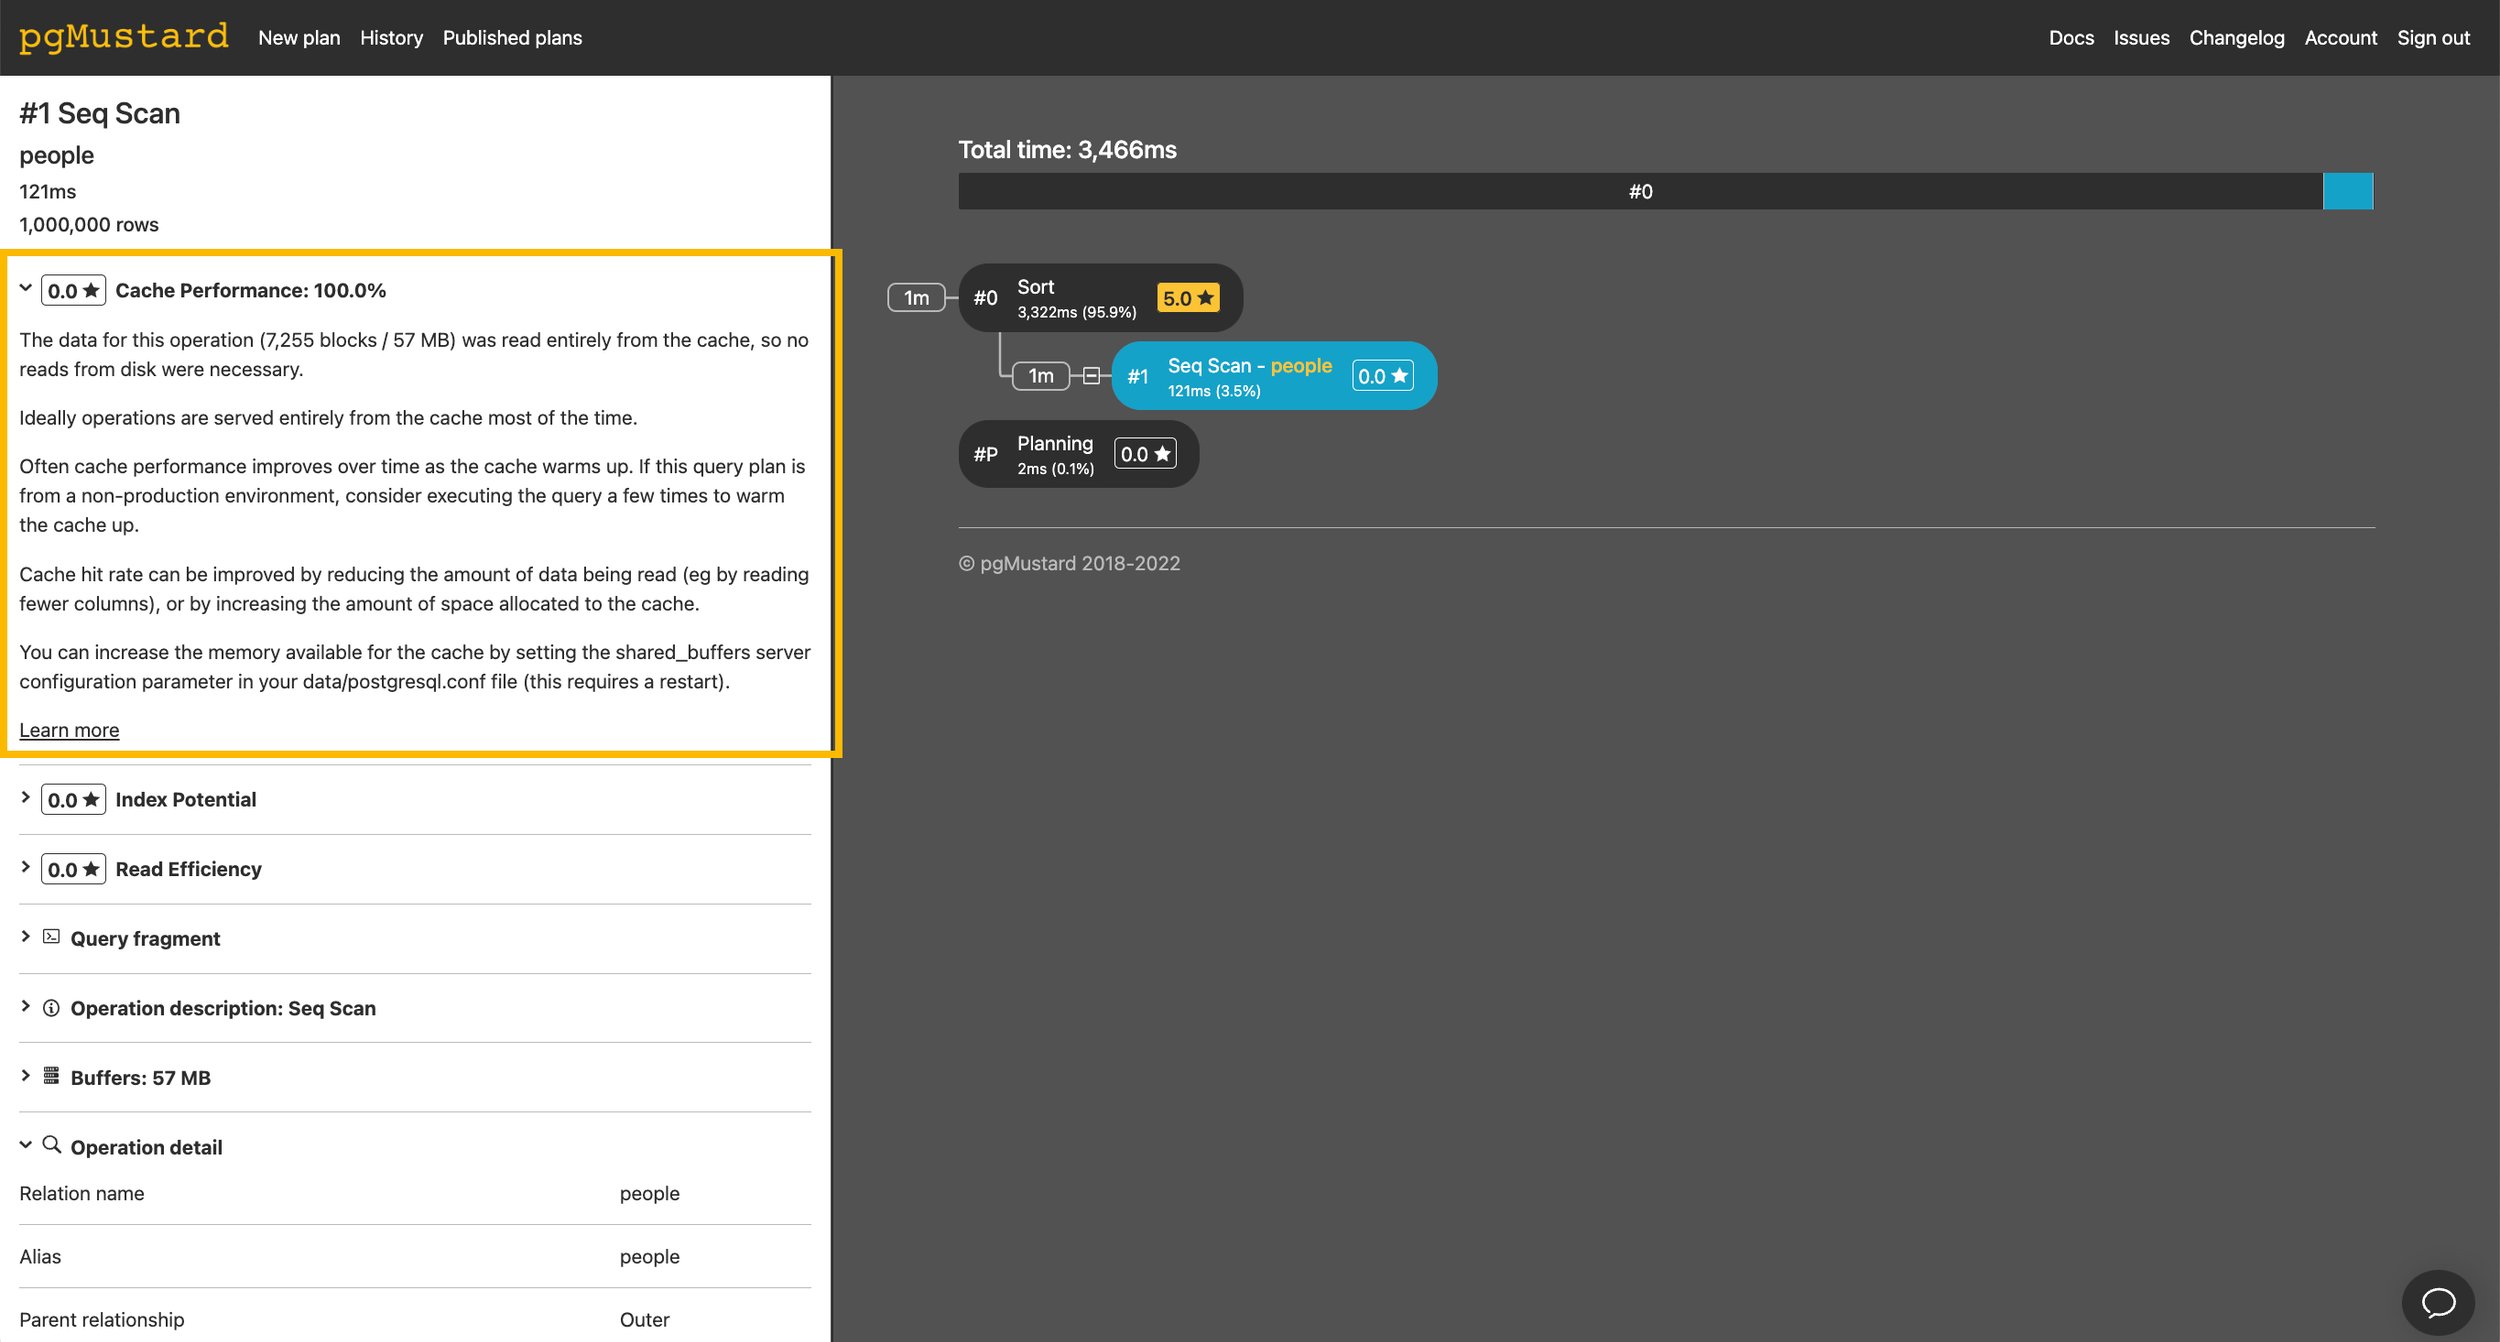
In pgMustard we report this ratio in “Cache Performace” tips. In this example, all data was read from the cache so the tip scored 0.0 (out of 5) to indicate that it is not an issue here.
Other areas and further reading
pgMustard also uses the buffers statistics in its “Read Efficiency” and “Read Speed” tips, and there are likely other things we could be using them for too.
In the blog post that argues that buffers should be on by default, Nikolay Samokhvalov describes several ways they also help you get a feel for the layout of the data on disk.
Conclusion
We’ve looked at several ways we can use the buffers data during query optimization:
Spotting operations doing way more I/O than expected — per-operation buffers
Getting a sense of the total I/O of the query — total buffers
Spotting operations spilling to disk — temp buffers
Clues to potential cache performance problems — shared hit vs shared read
And as a quick reminder, if you agree that buffers should be on by default and are willing and able to review the patch to do so, it would be extremely welcome. 🙌